Digital Work Analytics reporting
Start Improving Your Workday: Getting Baseline Data
Are you having the workdays you want?
Most people would say no. They are overwhelmed by their workload, spontaneous meetings, task switching, and distractions from work tools . Solving these problems starts with understanding what the workday looks like.
Simply put: Understanding how you work is crucial to operating more efficiently and sustainably.
Whether you want to streamline tasks or optimize workflows, you must know what is holding you back and which areas to improve. This starts by acquiring baseline data—the initial measurement of the workday that will be used for comparison after changes are made.
Produce8 is here to help with this process. We assist individuals, teams, and leaders in understanding how they work. Think of us as a fitness tracker for your workday. In the Produce8 dashboard and workspace, you can see your interactions with your work tools, your level of focus, and how you spend your time during the day.
Let us show you how it works.
Using Produce8 to get a baseline of your workday
You’re busy, so you don’t always have time to document your day. That’s where Produce8 comes in. We make understanding your workday a seamless process. All you need to do is follow these simple steps :
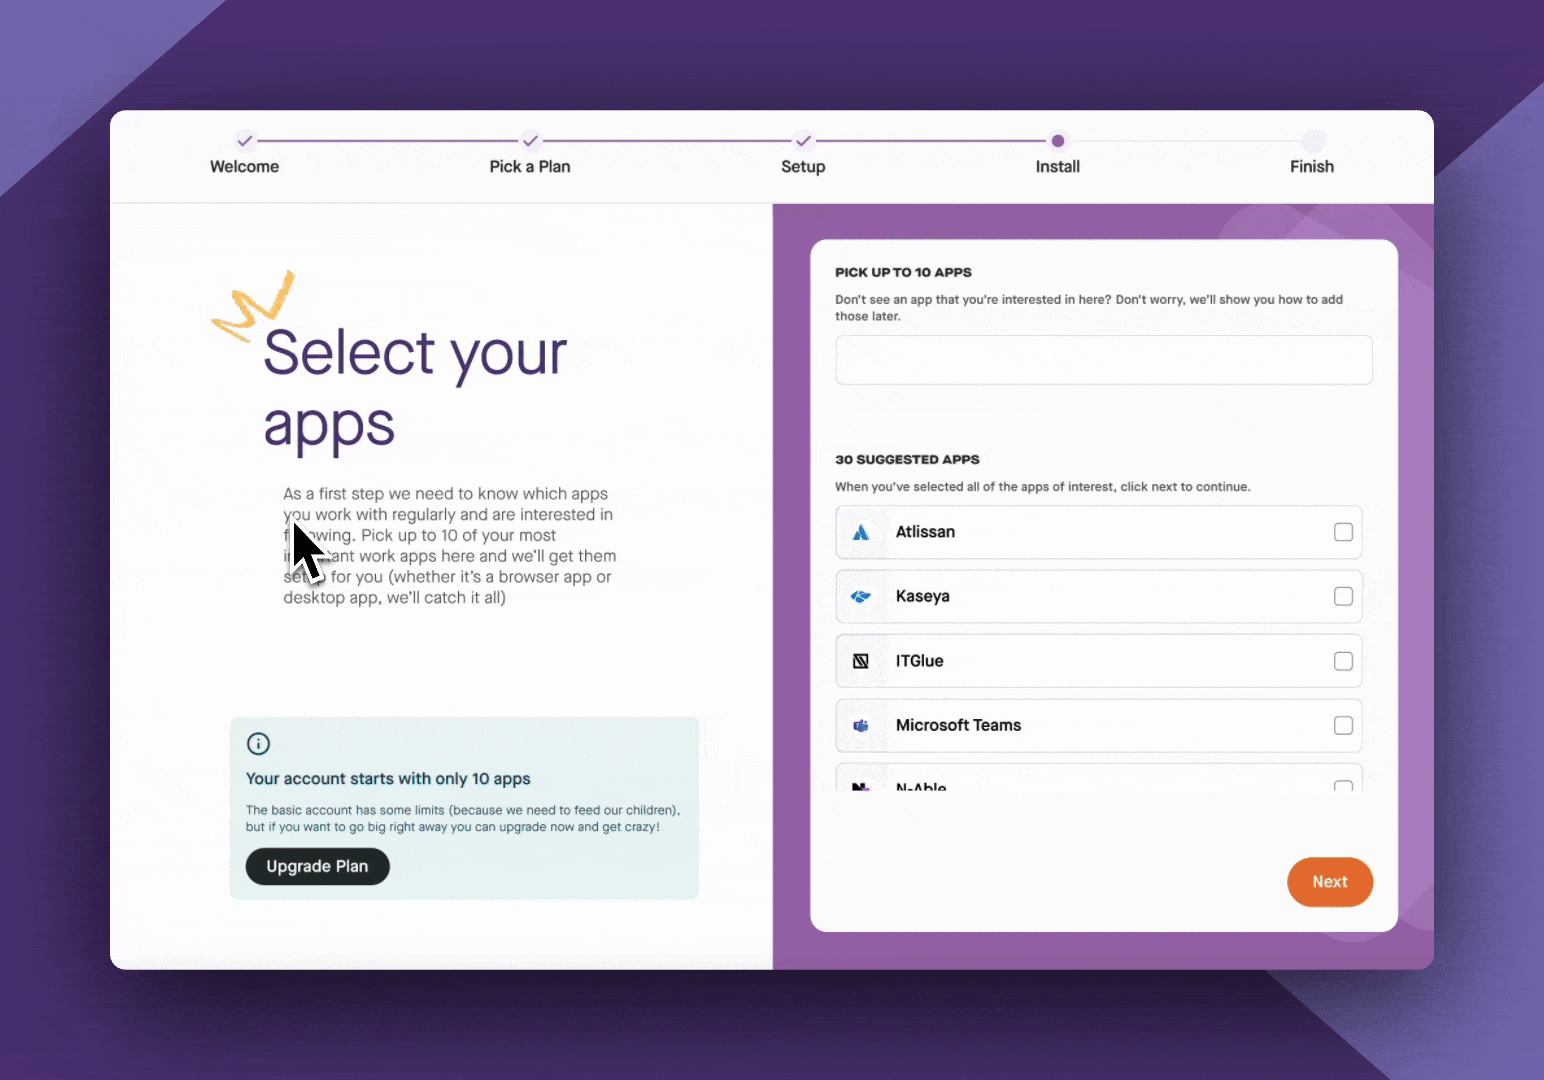
- Sign up to Produce8
- Link your work apps
- Add the Desktop and Browser extensions
- Continue with your work
- Return at the end of the day to view your data
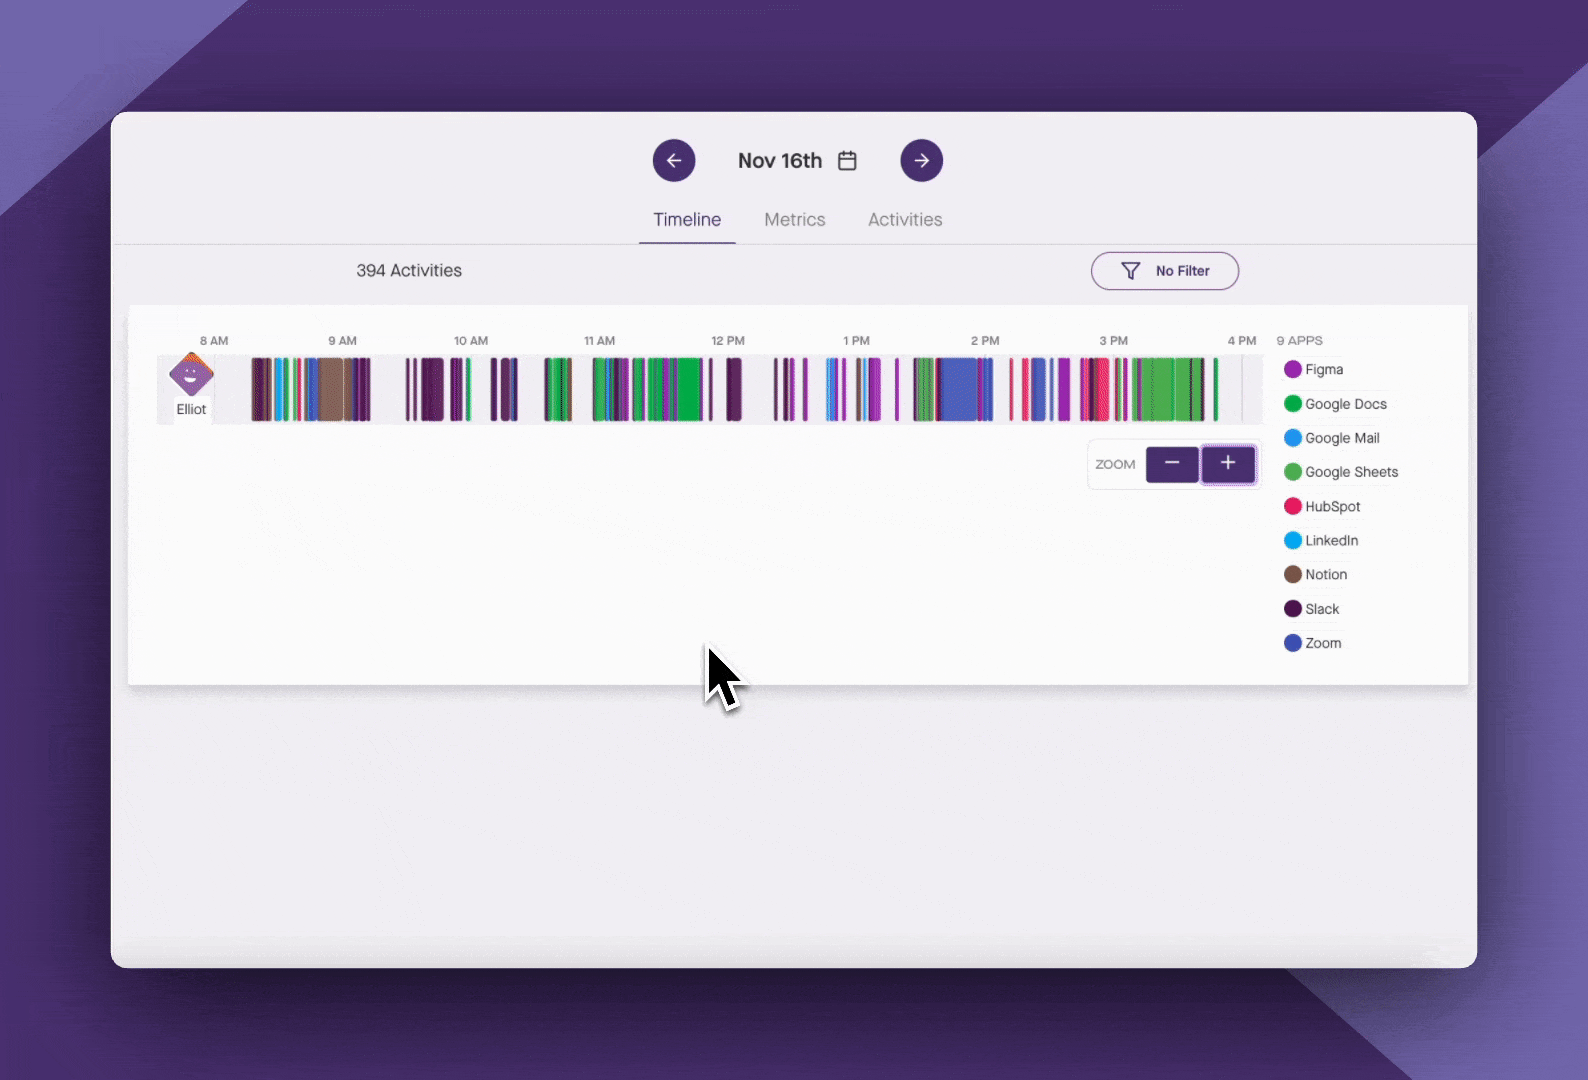
Get your baseline data to improve your workday
Once you have a few days of data, you can start to notice patterns and answer the following questions:
- Did my day turn out the way I expected?
- Which areas were holding me back from doing great work?
- What can I change to achieve an ideal workday?
Produce8 will never tell you how you should work. Instead, we offer insights formed by data. For example, we won’t tell you if working in a specific app is default good or bad. You’re in full control—we’re just here to support you.
Ready to get started? Let’s dive into an approach to analyzing your baseline data that has worked for our clients in the past. To begin, we will study data sets in order to improve focus and reduce distractions.
Improving focus
It’s fair to say that when you are focused, you’re working for an uninterrupted time on the apps you want to be working on. You are not multi-tasking or context-switching back and forth between browsers.
You can see this in the Timeline by filtering your productive apps. Are there long blocks of concentration? Or are you constantly switching between tools?
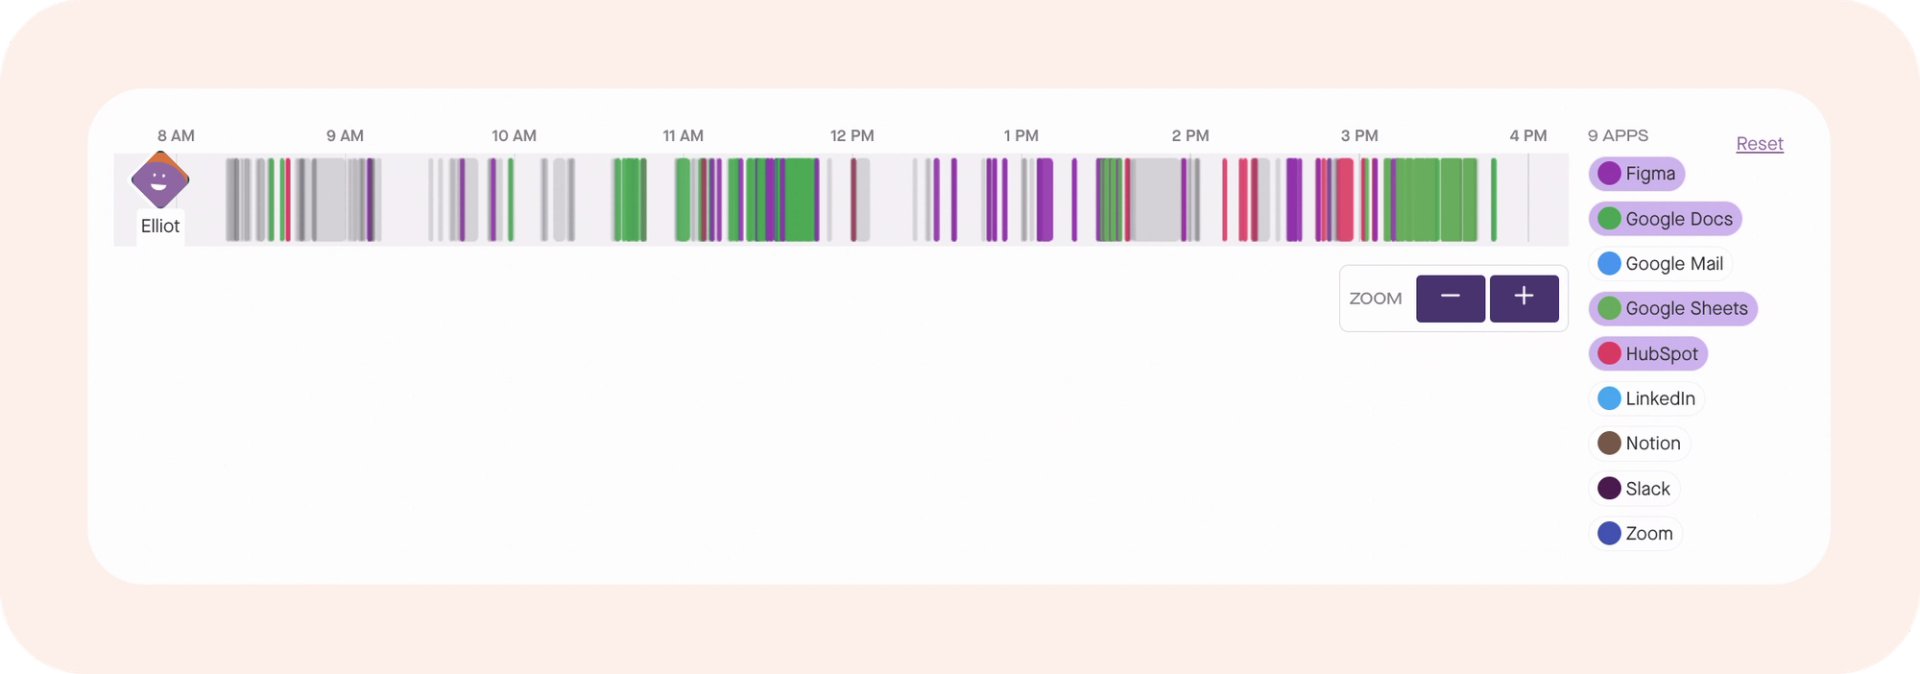
In this example, you see that the time blocks of 11 a.m. to 12 p.m. and 3 p.m. to 4 p.m. are when I’m most focused.
Next, go into Metrics and look at the Avg Duration of your App Usage and your Time in App. See how your statistics in that app compare to the rest of your tech stack.
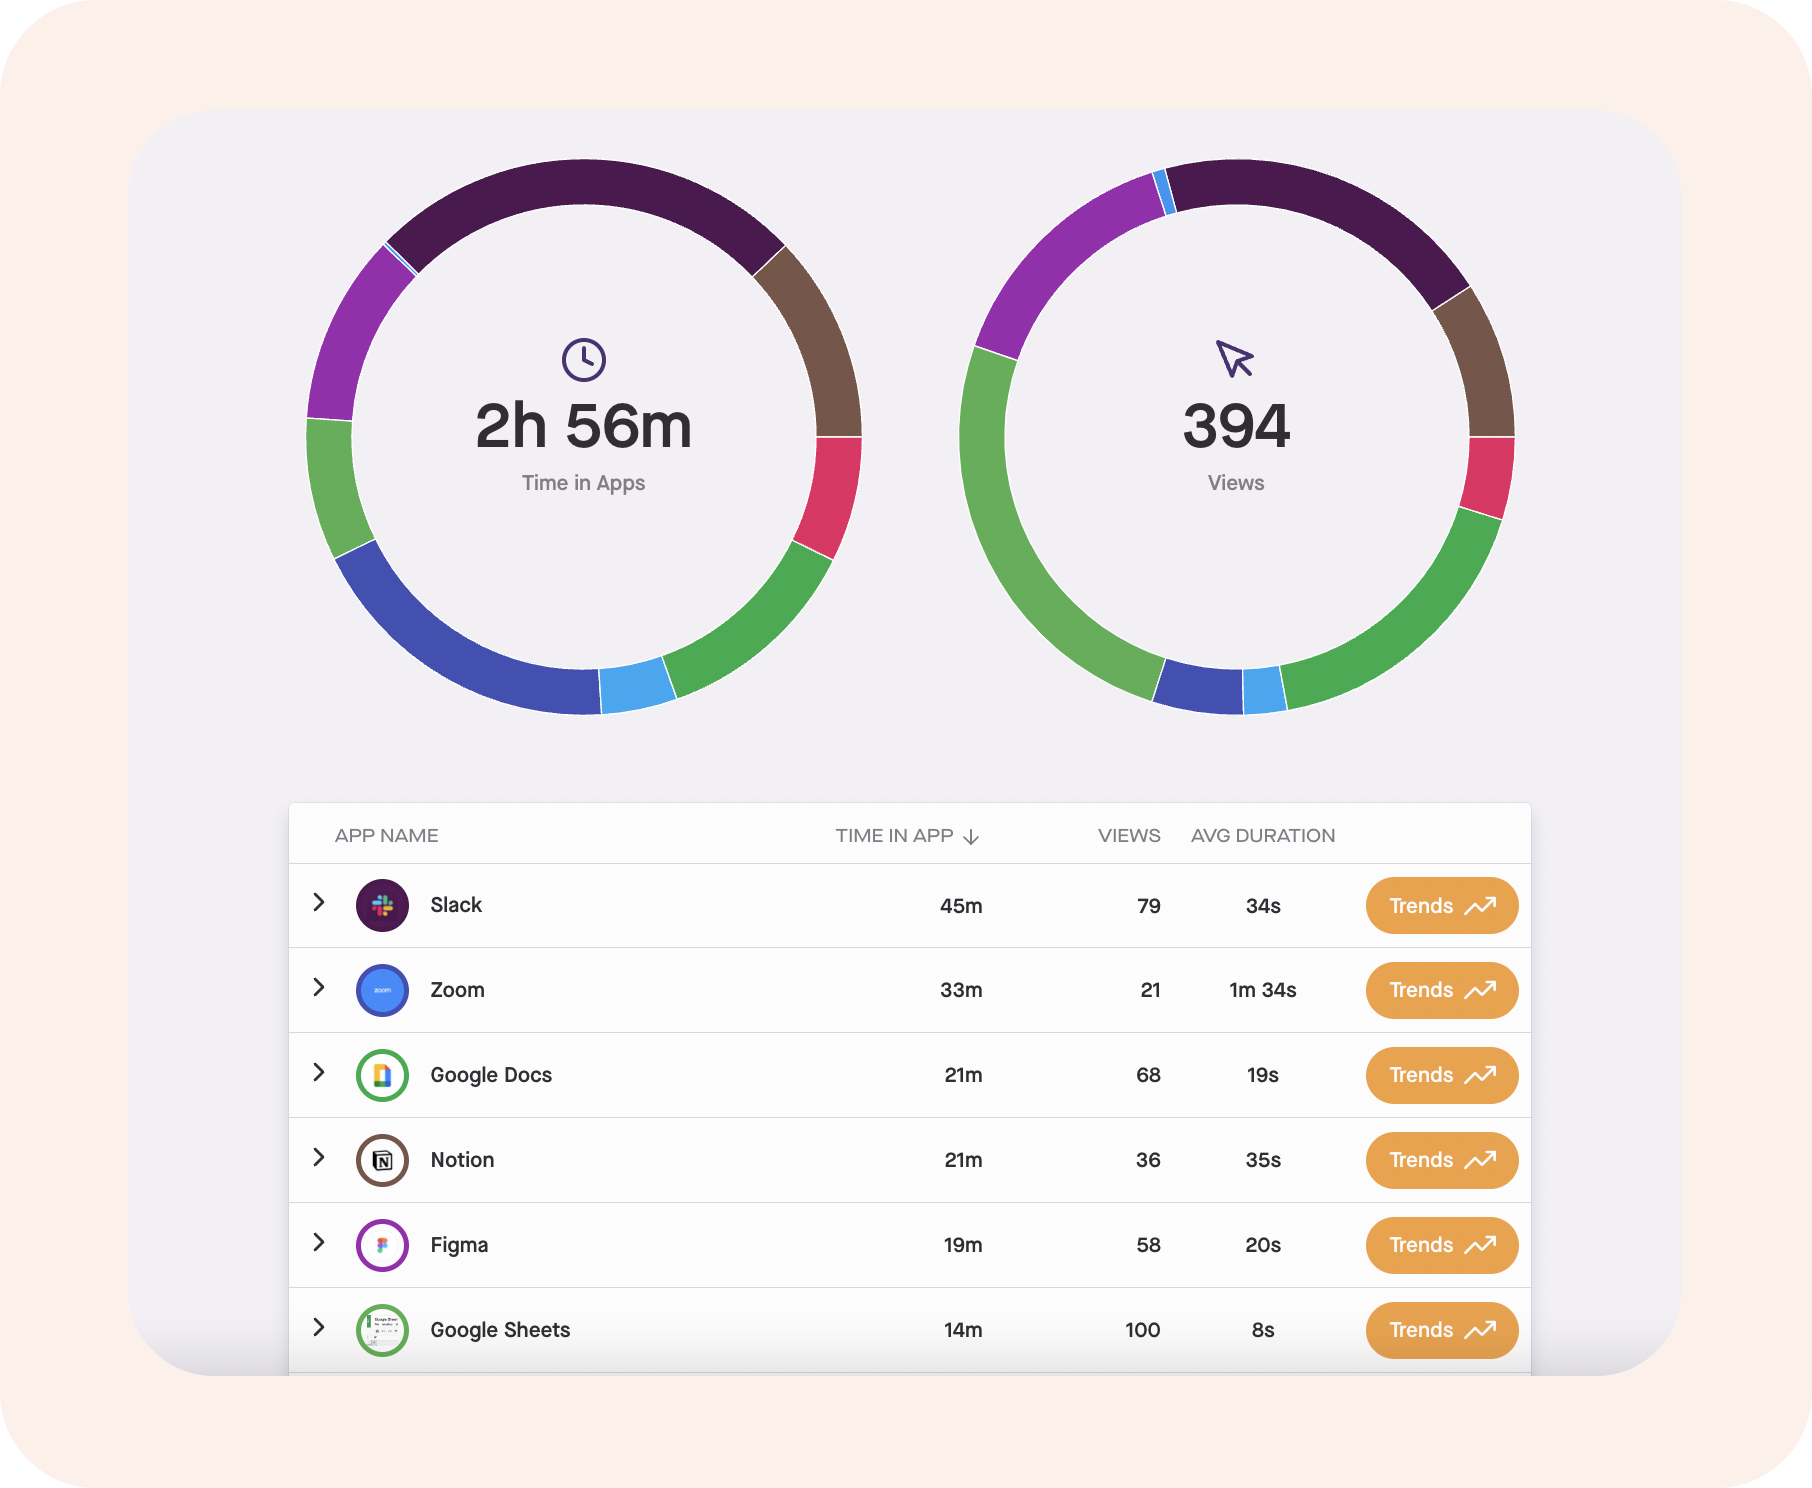
In this example, I only spent 21 minutes in Google Docs and 19 minutes in Figma out of a full workday.
When looking at your data, ask: Is that what you expected? Do you want to be working in the app more or less?
To assess your focus level even further, let’s see when you use your productive tools the most. Go into Trends to get a granular view of how you are using the app in a daily, weekly, or monthly capacity.
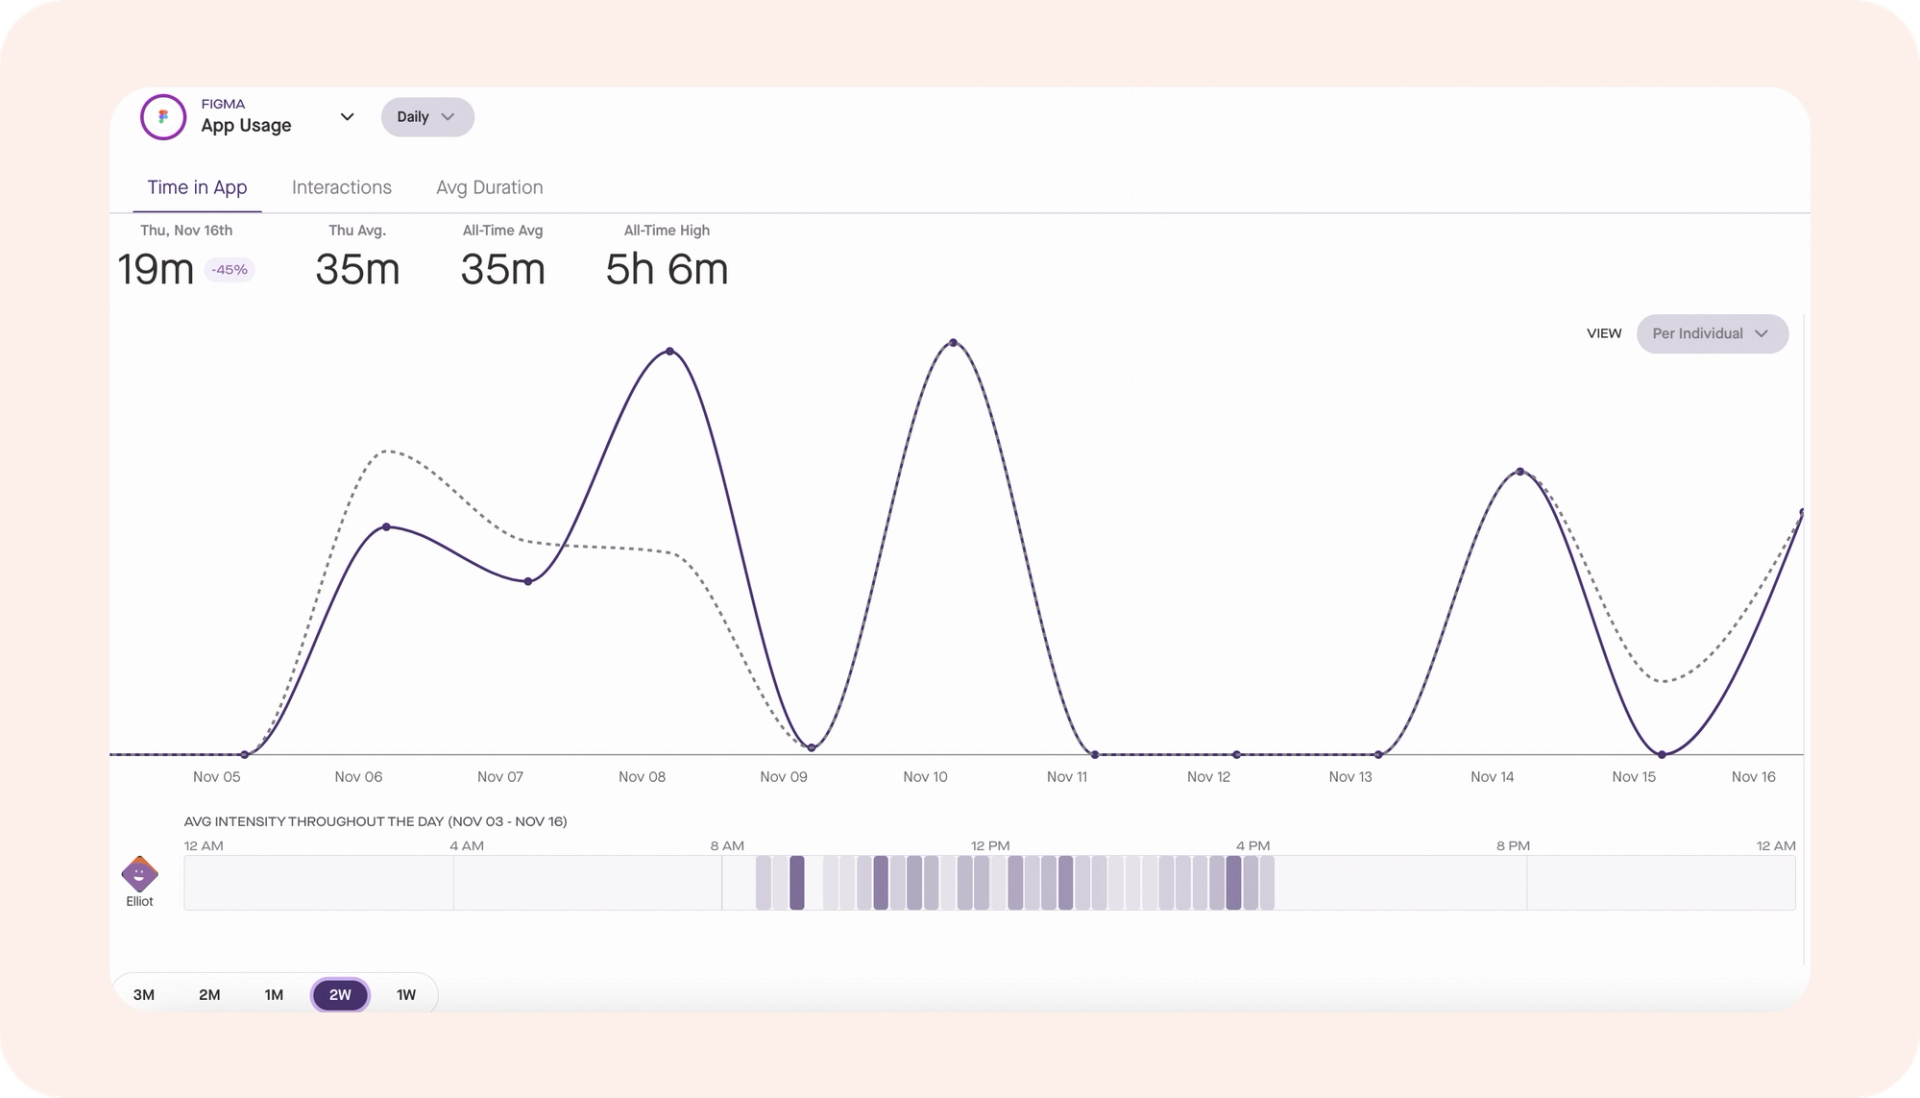
In this example, my All-Time Avg is 35 minutes. I also noticed that I’m most active in the app at the beginning and end of the day.
Using these data sets helps you decide the best times during the day to plan and schedule focus blocks. Answering the following questions will bring even more clarity:
- What aspect of your workflow is causing you to lose time in your most productive work?
- Have you allocated enough time in your day to do the work that’s important?
There will be days when you don’t spend quality time in your productive apps. You can check this by comparing your average daily usage to the rest of the week. Figure out why your time in that app decreased, then make changes. For instance, it might be helpful to rearrange your priorities for the week or schedule specific blocks of time to concentrate.
Reducing distractions
Get distracted often? We can help!
Go into the Timeline. There you will see which apps you have short interactions with. Those can be interpreted as interruptions to your day.
Common distracting apps are collaboration apps with notifications (i.e., Slack, Microsoft Teams, email, etc.).
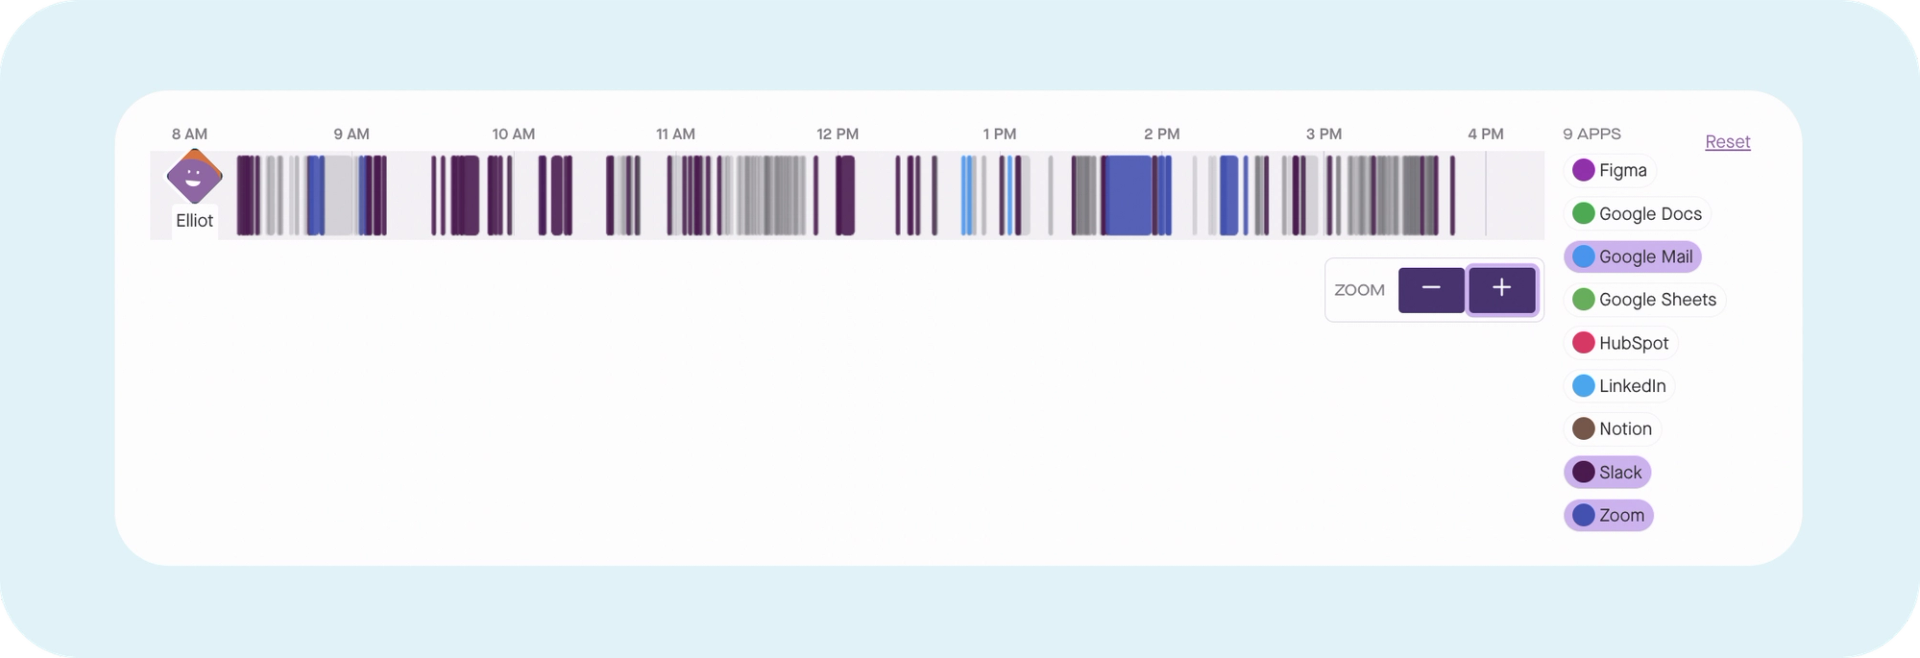
In this example, I’m switching back and forth between Slack for a significant portion of my morning. And in the afternoon, Zoom takes up a big chunk of time.
Improvements can be made by blocking time to check communication apps, turning off notifications, or working async with your team .
But before you take action, assess the data in the Metrics tab.
If you have a lot of interactions but short average durations, then the opportunity for improvement is clear. You need to reduce your total interactions and increase your average duration. The longer your interactions, the more meaningful they will be.

In this example, the data tells me that I check Slack 79 times a day. My average duration? Only 34 seconds!
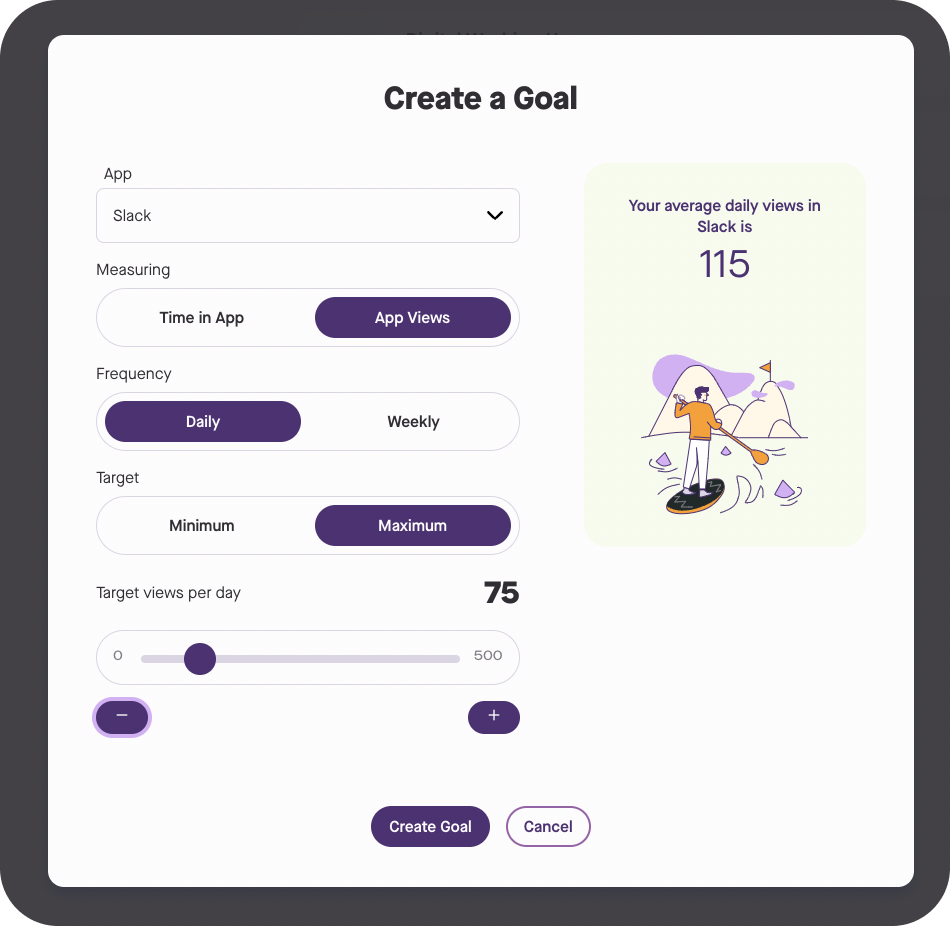
Produce8 enables you to set goals aimed at raising awareness of your tool usage. We suggest setting a limit on interactions with distracting apps to enhance productivity.
Let’s design the perfect workday
At the start of this article, I mentioned that many of us are not having ideal workdays. Worse, we don’t know how to change things.
Luckily, we have provided you with steps to get the insights you need, take action, and ultimately create space for great work.
Want to get started with Produce8? Book a free consultation with our team of experts today and we’ll walk you through the process! We’re truly obsessed with productivity and your digital well-being.
Related Aritcles
Digital Work Analytics reporting
Produce8 Launches Essential Insights: Revolutionizing Digital Work Analytics for Businesses and MSPs
3 min read
Unlock great workdays
Wether you are collaborating with your team or solo tackling your day we can help you recover the most valuable asset, time.
