MSPs looking for the Produce8 Playbook, look no further!
What’s new
Read everything related to major features releases and bug fixes. Click on any of the announcements and scroll down. If you have any issues or want more information, please reach out.
Featured Content


All updates & releases
Produce8 V2.1.1
January 16, 2023
Introduction
This release will allow our users to have their own Private workspaces.
- With ❤️ from the produce8 team!About This Release
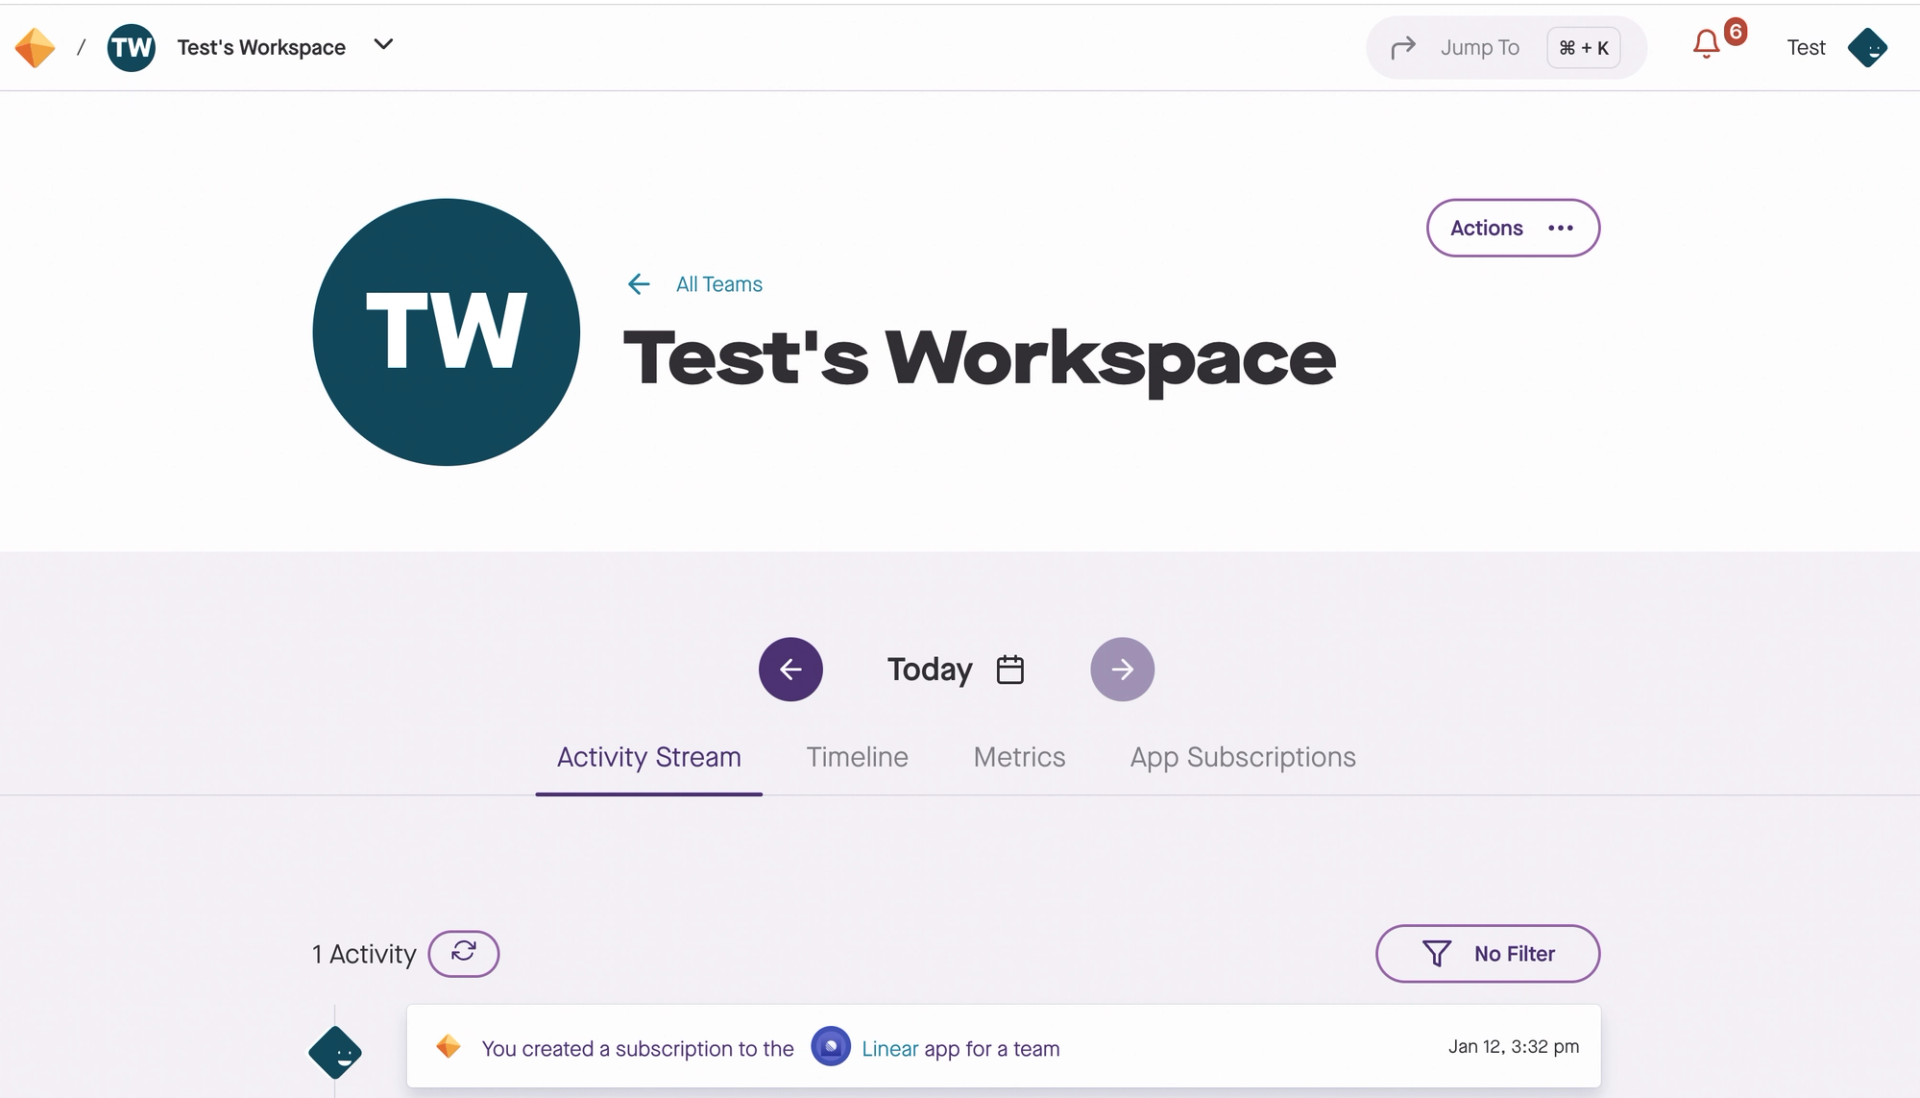
This release will empower our users to have their own private workspace. They can add apps that interests them, isn’t full of activities of team members, and whose data won’t appear in any other activity stream.
KEY HIGHLIGHTS:
- Every user will get a private workspace.
- Activities, Timeline, Metrics and App Subscriptions data will be available under your workspace.
- This data is exclusive to the user and will not be shared with anyone.
- The Private workspace tab is available on the homepage, right next to home.
Produce8 V1.4.4 (Alpha)
May 20, 2021
About This Release
This was a minor release addressing some bug fixes, including an update to deactivating users.
- With ❤️ from the produce8 team!Produce8 V2.1.0
March 16, 2023
Introduction
In this release we completed a significant upgrade to a microservices back end to allow the development team to introduce features faster. We also included a small number of new features, bug fixes and UX improvements. The application is now significantly more performant.
- With ❤️ from the produce8 team!New Features
Browser Extension Diagnostics
In the process of putting out this upgrade we experienced some issues with the browser extension and had to temporarily deprecate some functionality to ensure that we could offer backwards compatibility between the extension and the application. We have now introduced extended diagnostics in the plugin to ensure faster problem resolution in the future.
Known Bugs
Events Sent Today Count in Browser Extension Diagnostics Showing Incorrect Count (PRO 2548)
Produce8 V1.5.7 (Beta)
December 16, 2021
About This Release
This major release introduced:
- updates to the user timeline
- updates to metrics
- changes to licensing to add higher usage limits for free accounts
- changes to the app pages, and
- minor UX improvements.
The release also addressed a large number of outstanding bugs.
- With ❤️ from the produce8 team!New Features
A page for individual users within the context of a team
When clicking on a team member, Produce8 was previously displaying all of that individual's data, regardless of whether the team was subscribed or not.
Now when you click on a team member in that context, we only display the individual's data that's shared with that team. So if you're on two or more teams with the same person, you'll see different data about that user in each team.
Account tier and feature licensing limits
We've introduced license limits in preparation for releasing both free and paid version of Produce8. You'll find the license information in the account page.
We've added notifications, errors and in-context messaging about license limits where appropriate.
App color picker
We introduced colors for each of your apps to make it easier to interpret timelines. Colors can be selected when creating or editing apps.
Redesigned app page
We added a completely new app page with redesigned tiles to make the best use of the space. We also added search so you don't create redundant apps, and we now sort them alphabetically.
Improved UX on app creation
We've had to do a better job of guiding users through the app creation process—no matter where they're starting from in their understanding of the product—as the concept of apps has evolved. Accordingly, we've put some work into two- and three-step app creation workflows.
Bug Fixes
Timeline is windowed (PRO-816, PRO-897)
This is a partial resolution to the issue that expanded the number of events that would display in the timeline to 1,000 events. A longer-term fix is coming in a future release.
We've also decided to separate the fetch of the timeline visual data from the details.
Produce8 App Categorization and Permissions
August 1, 2024
Introduction
Produce8 helps you understand your work patterns by showing your interactions with the apps you use as you navigate your workday. But since individuals often use up to 40 different tools throughout a day, and several apps to complete a specific task, it can be hard to see how those interactions depict specific units of work or workflows. App Categorization lets users group interactions from multiple apps into a single task or subject.
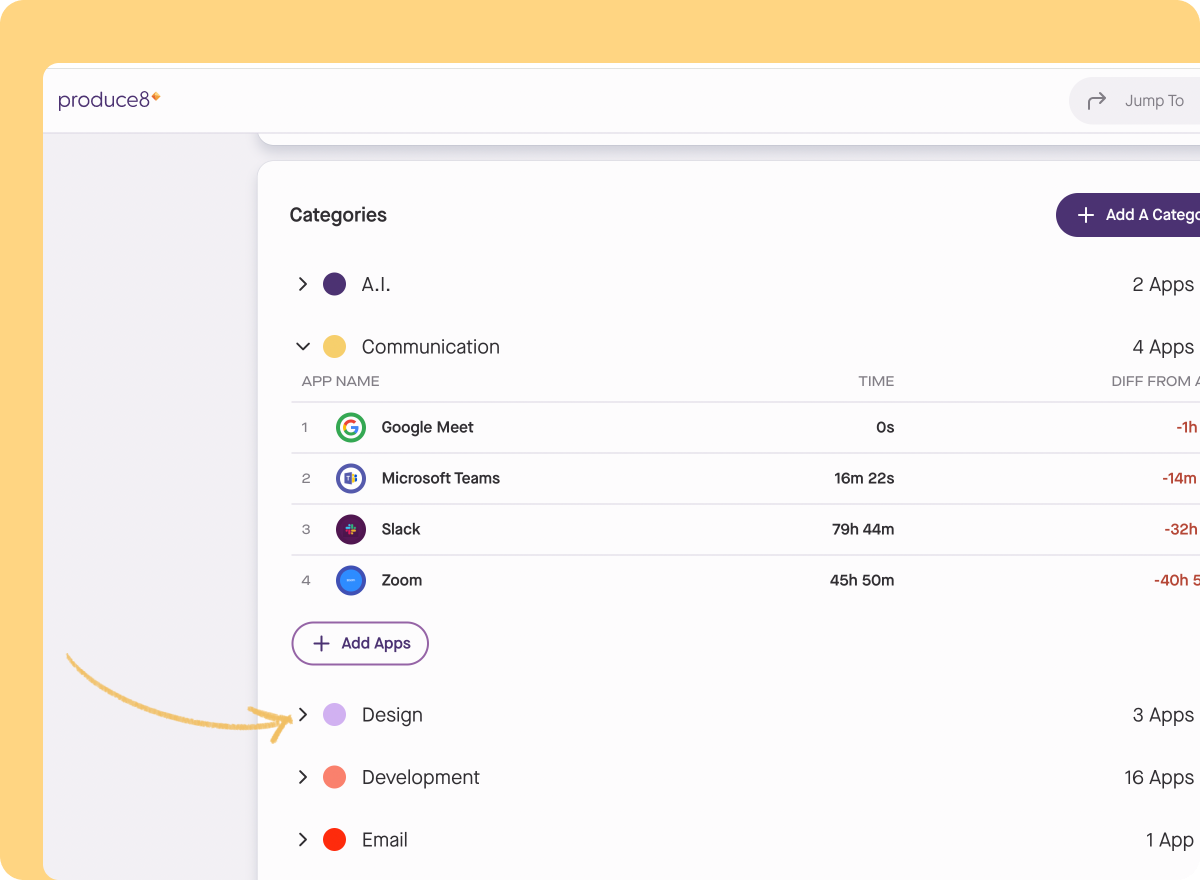
You can now create custom App Categories and group apps for the same purpose or workflow. You can see stats across your categories within your Daily Summary, Account Metrics and Dashboard, Workspace, and also on the Categories Home page.
App Categories are set at the account level, and apps listed in the Produce8 App Catalog come with pre-defined categories that can be edited as needed.
- With ❤️ from the produce8 team!About This Release
These new features in Produce8 were built by: Jordi, Gavin, Brandon, David and Mike, Liam, Sasha, and Christine
New Features
Every app in Produce8 has a set of associated metadata such as the app name and logo. An App Category is now available as an additional metadata label for an app. It is customizable at the account level and pushed out to all users in that account. So an app like your SalesForce CRM could be defined as a “Sales” app or even as a “Core Business” app. This feature will allow for broader metrics in Produce8.
The App Category page can be found by clicking on Apps and Categories from the user context menu and then selecting the App Categories tab.
This page has two components:
- Metrics associated with each app category
- A list of categories where you can manage their definitions and include individual apps
You can add categories, manage apps within a category, edit categories, and delete categories as needed.
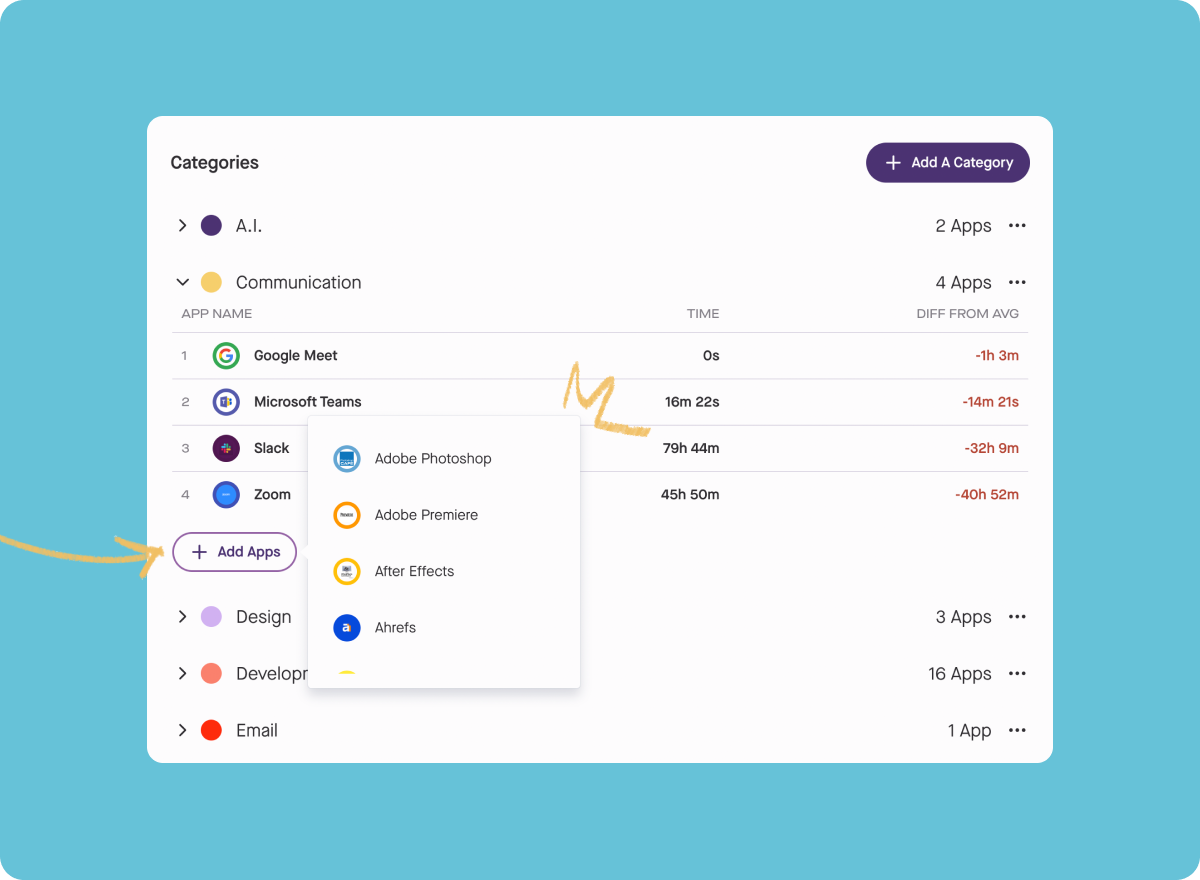
Your Daily Summary report will now include a breakdown of time spent in each category. You can click on it to view the time series data associated with each category.
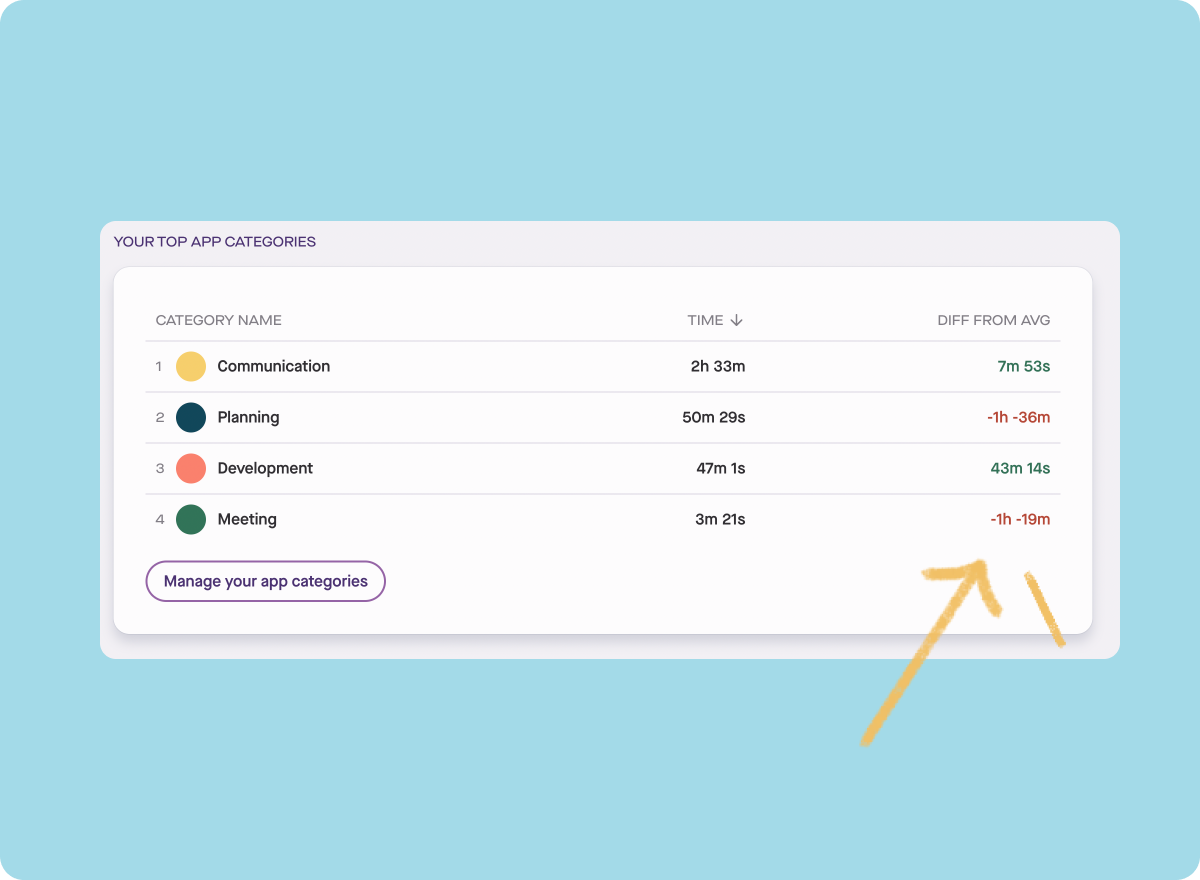
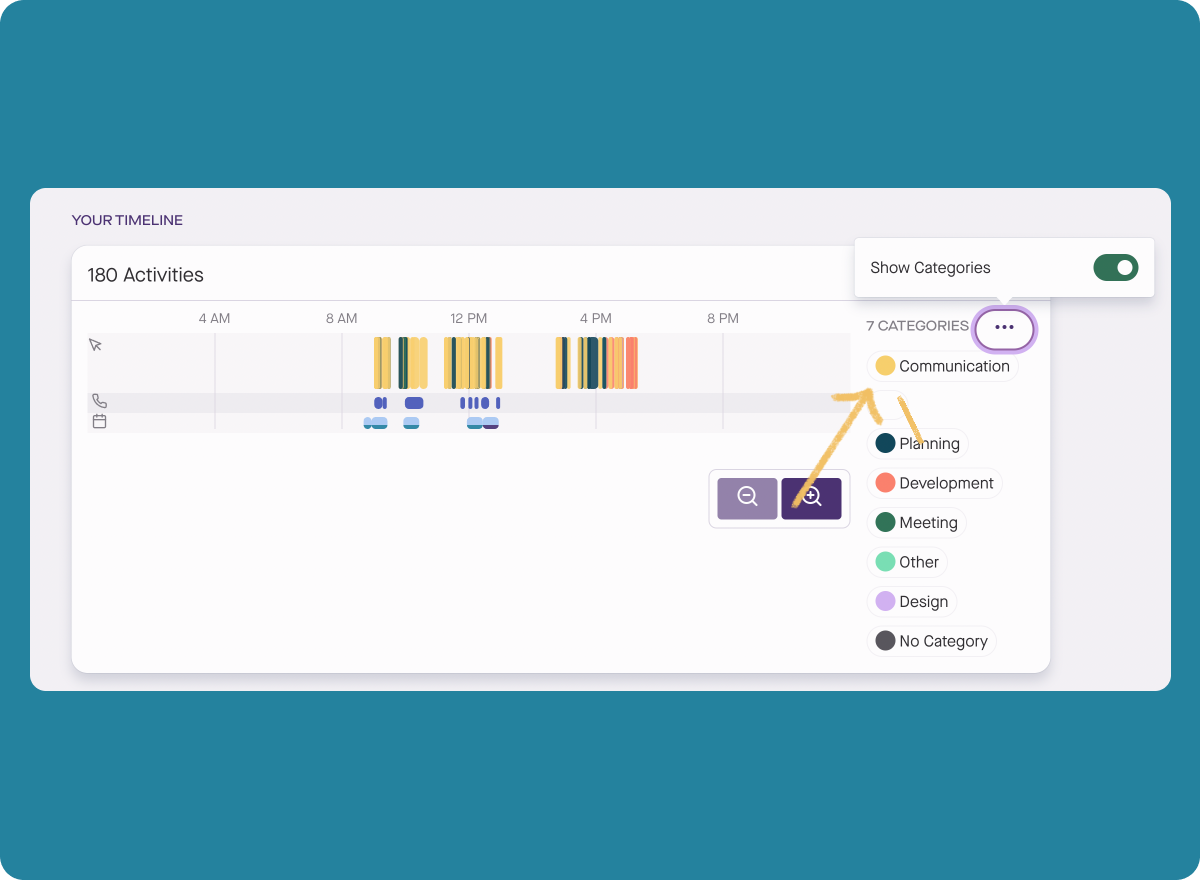
You can also switch your Timeline view between Apps to App Categories.
Your Account Summary report will now include a breakdown of time spent in each category.
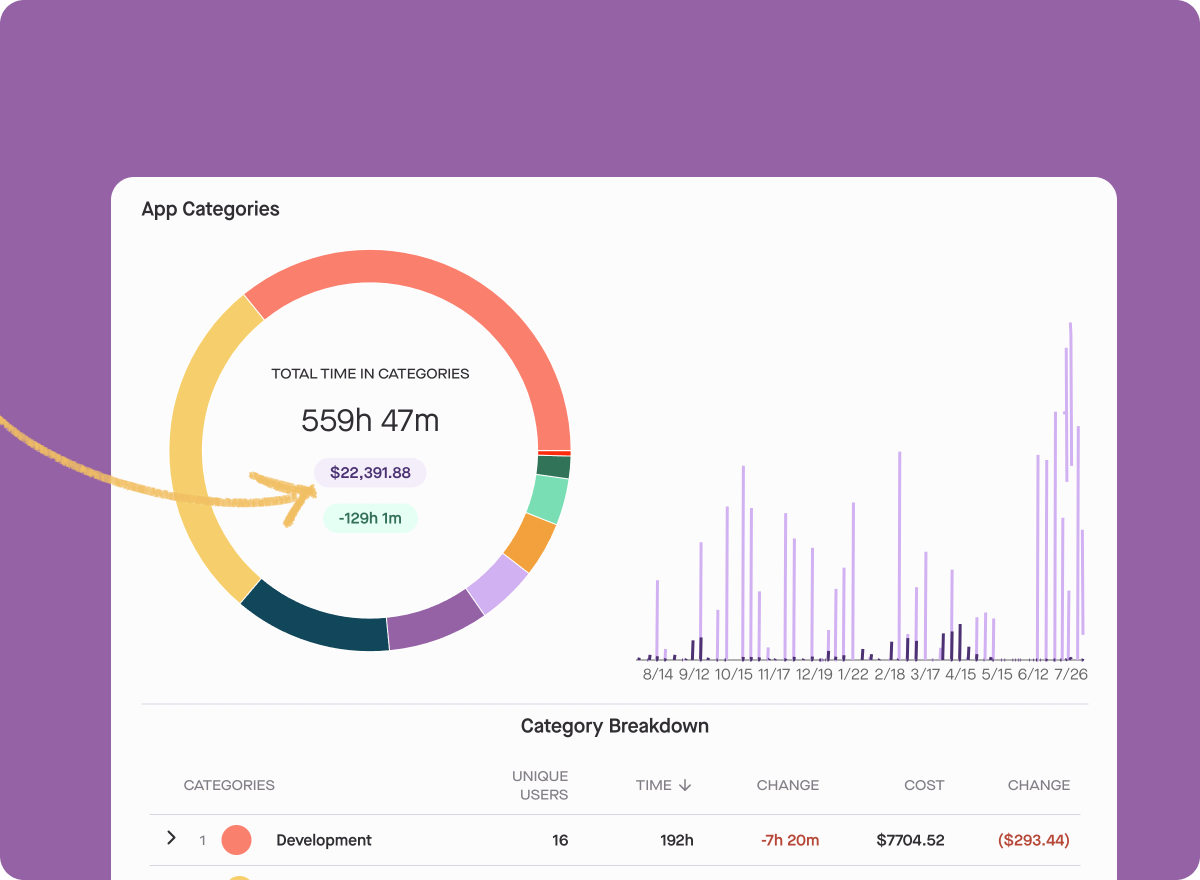
You can find the App Category Metrics in Account Summary by going to Account Metrics and selecting the App tab.
Clicking on each category gives you an overview of time spent in each category by Workspace and Apps within that category.
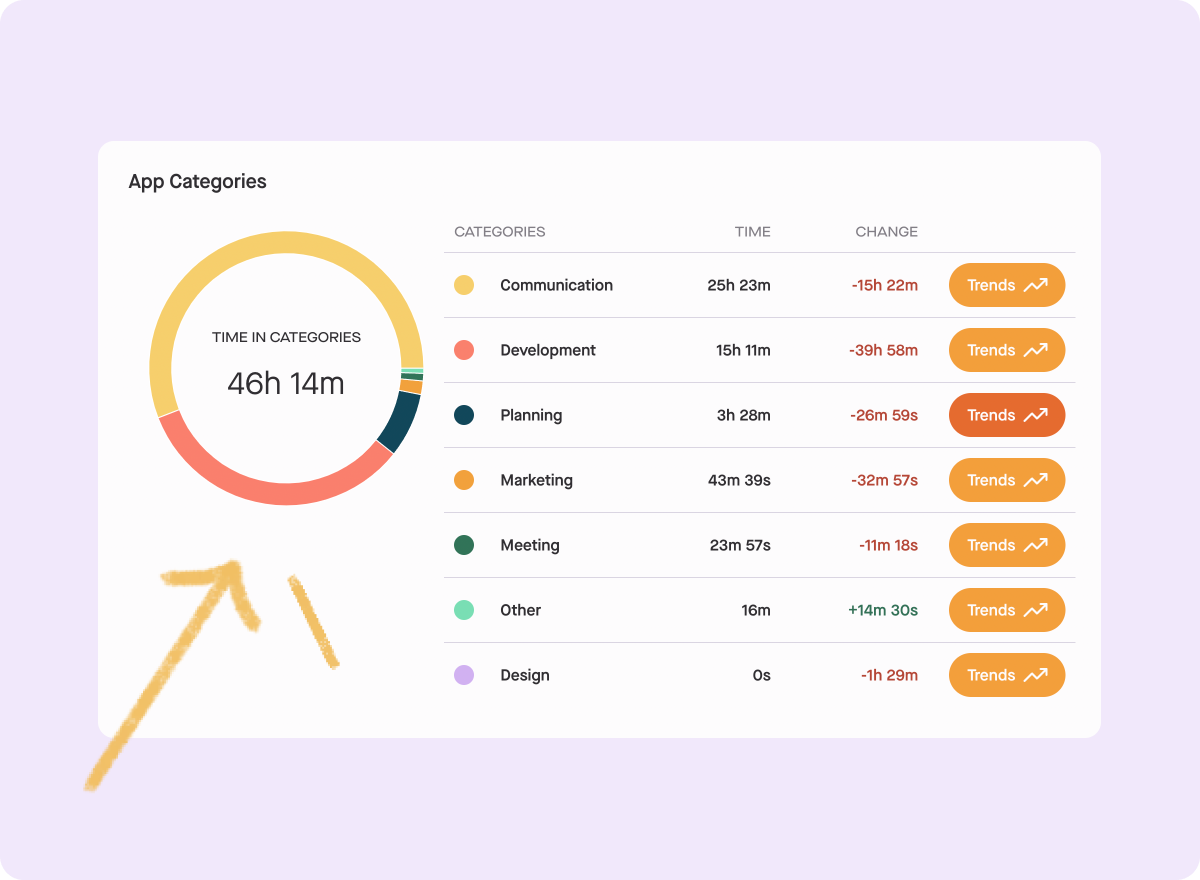
Workspace Metrics will now include a breakdown of time spent in each category. You can click on it to view the time series Trends associated with each category.
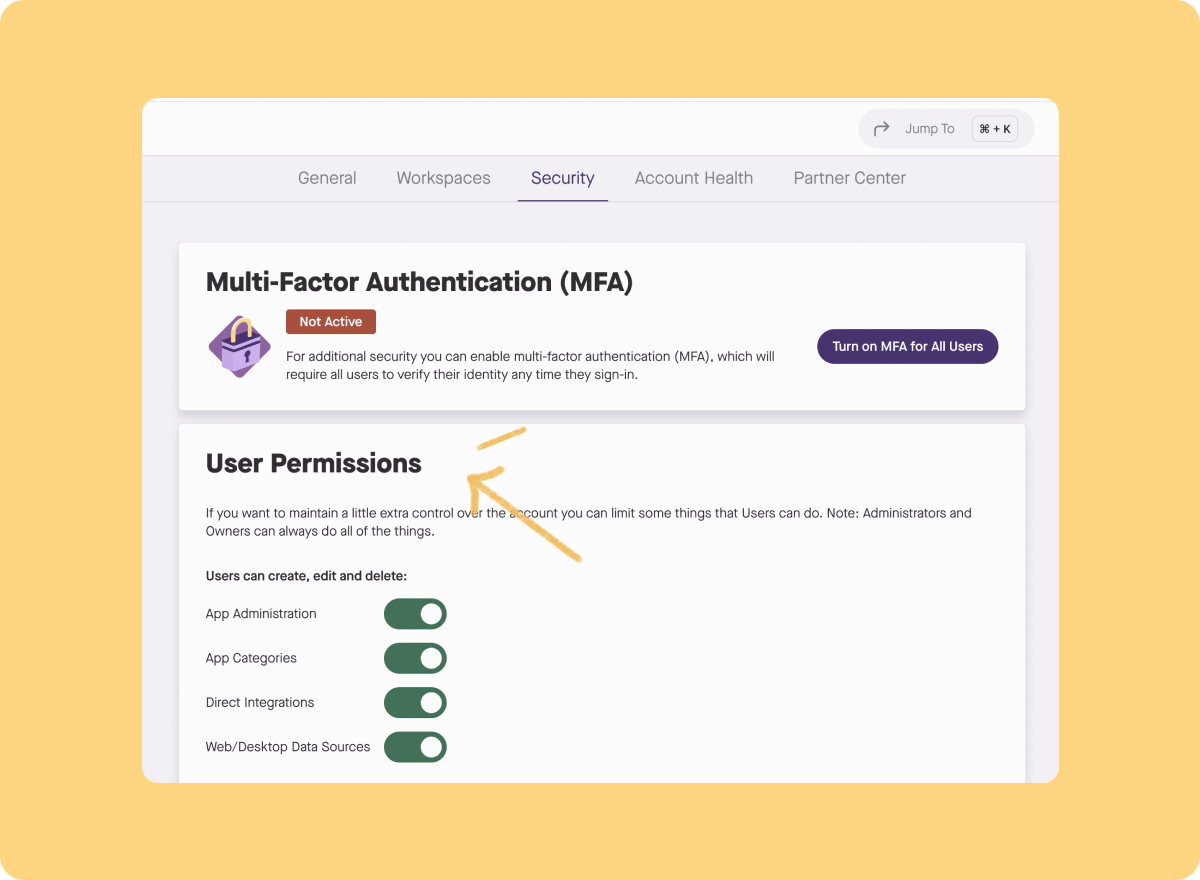
Currently, any user can manage Apps, Categories, and App Subscriptions, which can lead to issues such as duplicate apps (multiple versions of the same subscriptions).
This feature allows Account Owners and Admins to manage permissions for Apps, App Categories, and App Subscriptions.
By default, these User Permissions will be toggled off, limiting the management of Apps, Categories, and Integrations to Admins and Owners. This is to simplify the management and maintenance of data sources.
You can access the User Permissions page by clicking on Account > Security tab.
Another Big Product Release from Produce8 - Mobile App Now Released in Beta
October 16, 2023
Introduction
Work is crazy - we can fix this
We are maniacally focused on helping everyone recover 90 minutes back in their day by helping them understand their work patterns, identify where the time loss is, and showing the impact of the things they are doing to fix their workflow.
Self awareness leads to change
Fitness tracking apps, personal digital wellbeing tools and financial management apps have proven that self awareness is a big component of laying the foundation for behavior change. Produce8 works on the same principles, but for the workday.
Let’s not add to the noise
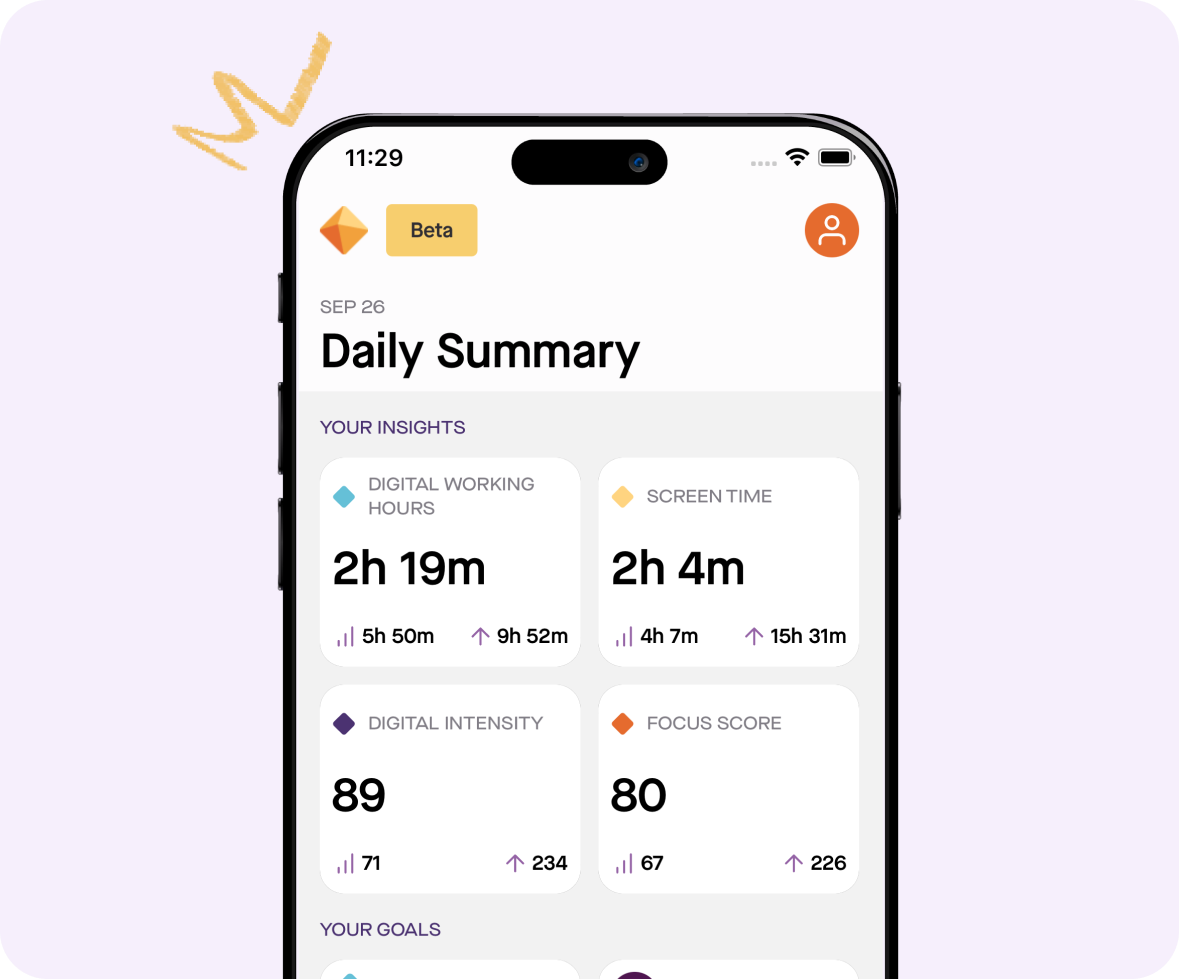
But we don’t want to add to the distraction. So we made the daily report the key component of the mobile experience. Our objective is 90 minutes back in your day in less than 90 seconds of use. Produce8 summarizes your workday and your progress against your goals. The mobile app is meant to check how the day went yesterday and how things are trending over time. Check it once a day and get back to your life. We will help you stay focused - on focus.
- With ❤️ from the produce8 team!About This Release
This new feature in Produce8 was built by: Liam, Washington and David.
New Features
Built for iPhone and Android Mobile Phone Devices
The mobile app was built for phones and does not run on tablets. The full browser app works well on tablets already. If you are signed up for Produce8, download the mobile version in the app stores for Google and Apple
The Mobile App is About You
Unlike the browser app, the mobile app summarizes your day. Not what is happening in your teams. It is meant to reinforce the changes you want to make for yourself.
Just the Important Stuff
If you still want to get into the weeds and identify patterns of work, understand how your teams are doing, use the browser based app. The full app is meant for spending more time and doing deep dives on the data. The mobile app was designed to keep you focused on your workday.
View Defaults to Current Day and Scroll for Past Days
When we send you daily summaries via email they are about yesterday. When you open the mobile app, it defaults to showing you today. You can click back as far as your licence allows. Paid plans can see three months worth of data, and free plans can see the current week and the previous two.
Personal Insights and Trends
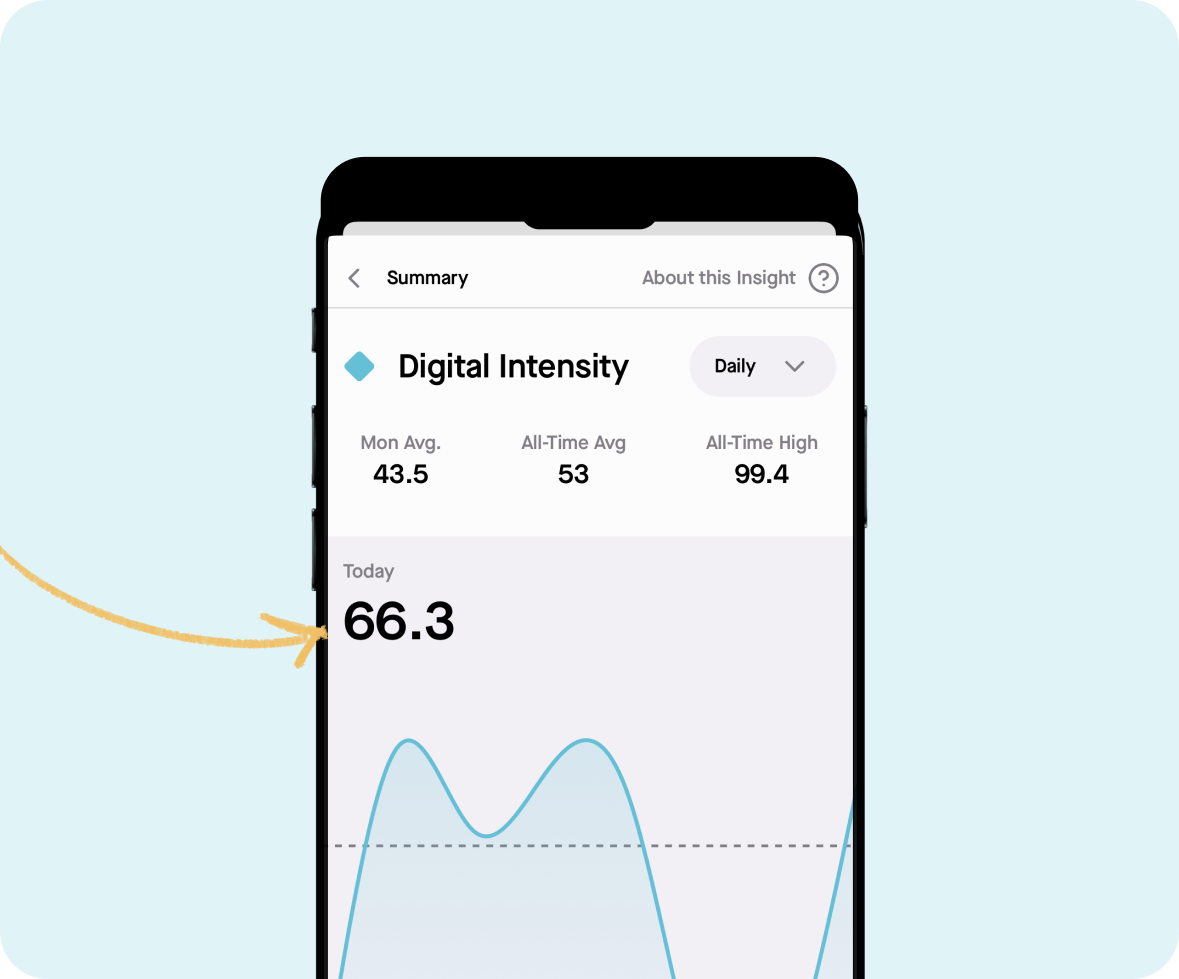
Personal insights for focus, digital intensity, working hours and screen time are the first features in view. You can click on any of them to see the time series history.
Goals Progress and Trends
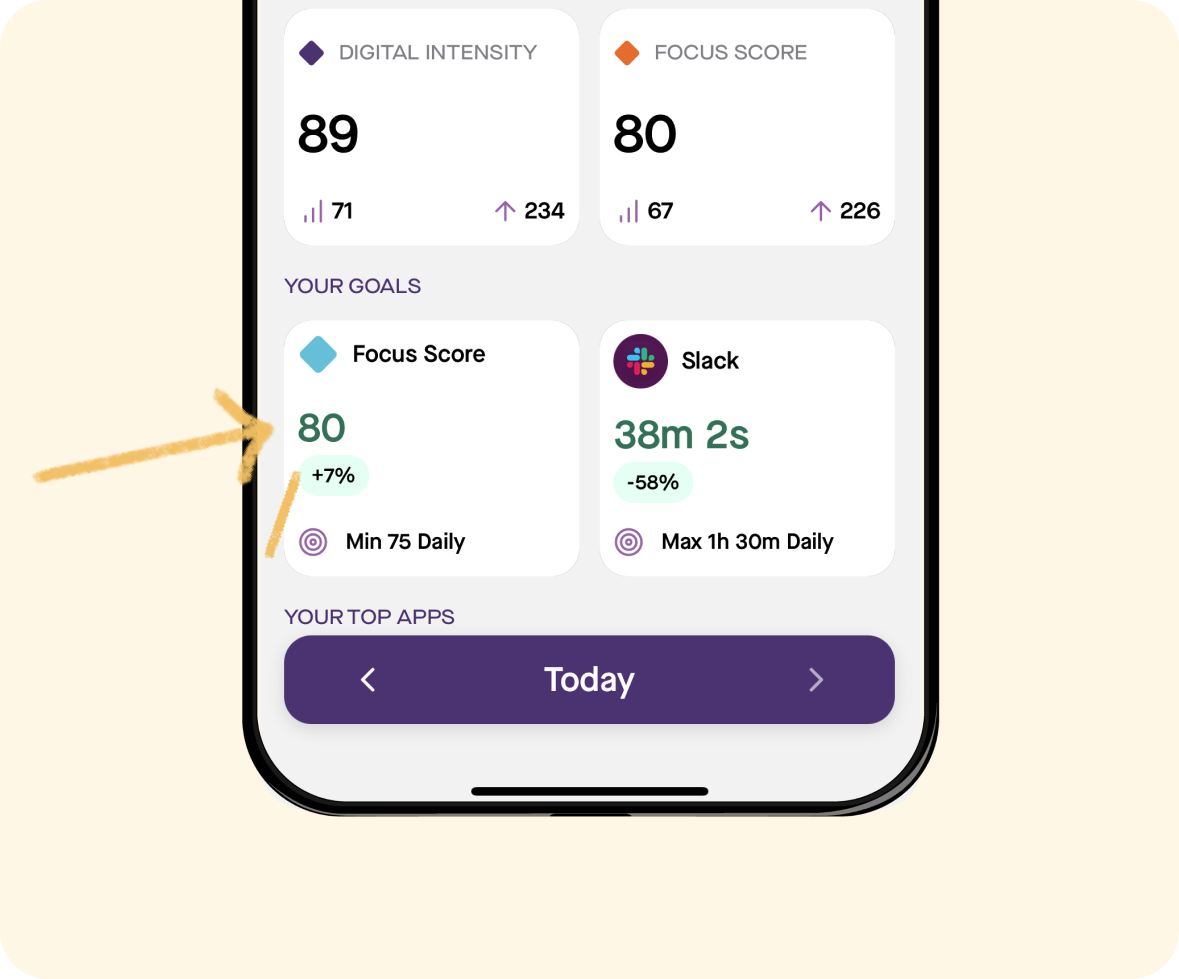
We recently launched goals and immediately added it to the mobile app as well. You can see each goal you have set and click on them to see the metric that goal is related to.
Top Viewed Apps Daily and Trends
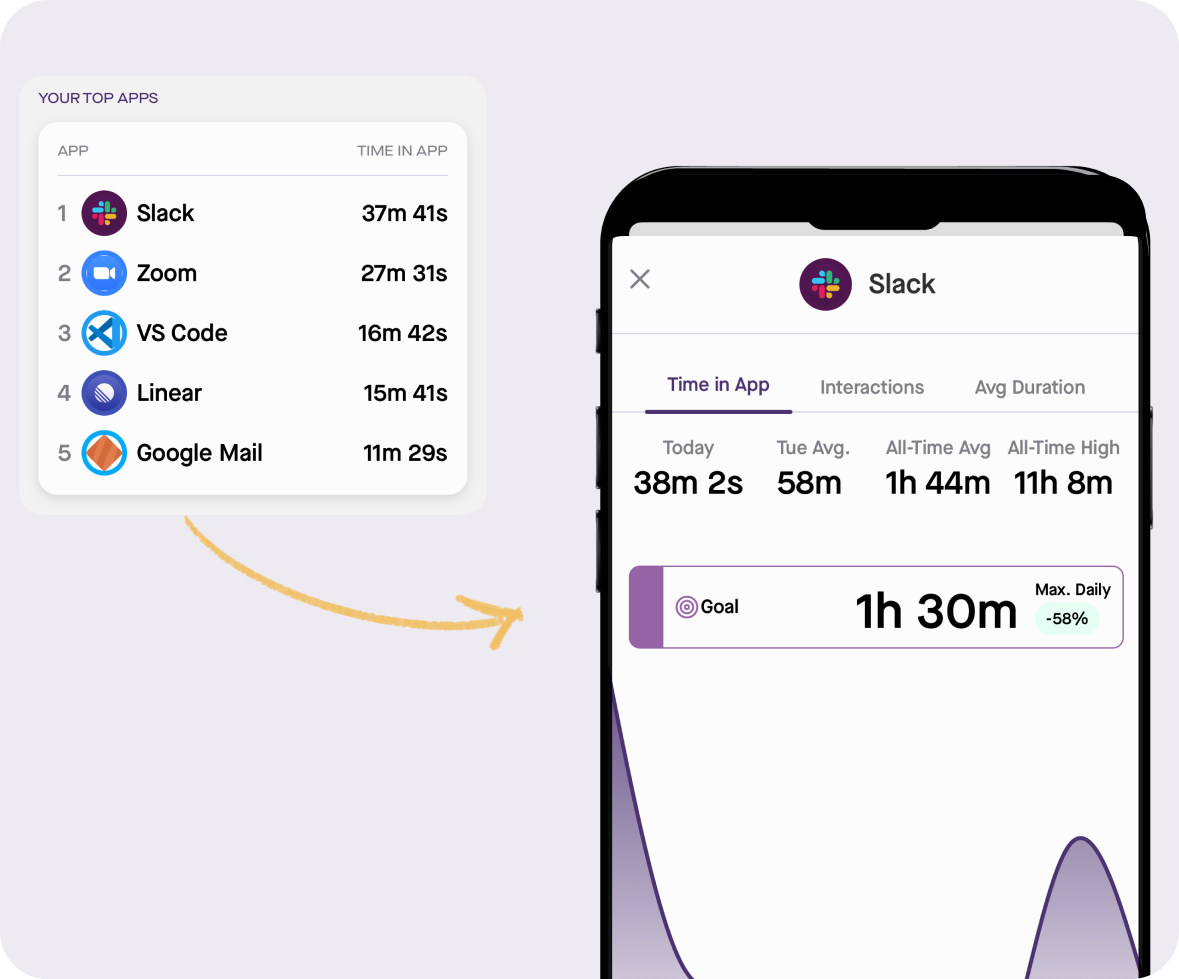
Which apps have you spent the most time on every day? We show you which of your tools you spent the most time looking at.
User Menu
The user account menu provides navigation for sign out, opening tickets, navigating to our knowledge base and product updates.
MFA Support
The mobile app supports the MFA settings you have set up for your account.
Account Creation Not Supported in the Mobile App
We do not currently support creating new Produce8 accounts by downloading the mobile app. Please go to the browser to complete sign up.
User Feedback Needed on The Future of This App
We are in the process of collecting input on using the mobile app as an extension to track business app usage on the mobile device. Please reach out to us if you have input.
Major Feature Release: Calls
March 12, 2024
Introduction
How many hours per week do you spend on video calls, huddles, and virtual meetings?
What other tools are you interacting with during that time? Are your goals to reduce the impact of virtual meetings on your workday having any impact? You can now actually measure it with Produce8!
We are super excited to announce the release of our “Calls” integrations and related features.
Introducing Produce8’s Calls Features
We can now show you the time you spend in calls, huddles, and virtual meetings across all of your collaboration apps including Microsoft Teams, Slack, and Zoom.
With this new feature, we couple your “App Views” (for example, actively looking at the Zoom window) and “Calls” (the actual time in a virtual call), allowing you to better understand how you spend your time and engage with your tools.
The new Calls features are useful when addressing workplace questions such as:
- Are you spending too much time per day on calls?
- Are you participating in too many unscheduled or unanticipated calls?
- Are you even paying attention to these calls, or are you multitasking working in different apps?
About This Release
This new feature in Produce8 was built by: Jordi, Brandon, Anthony, David, Gavin, Sasha, Andrew, Jeff, Nicole, Christine and Wash.
New Features
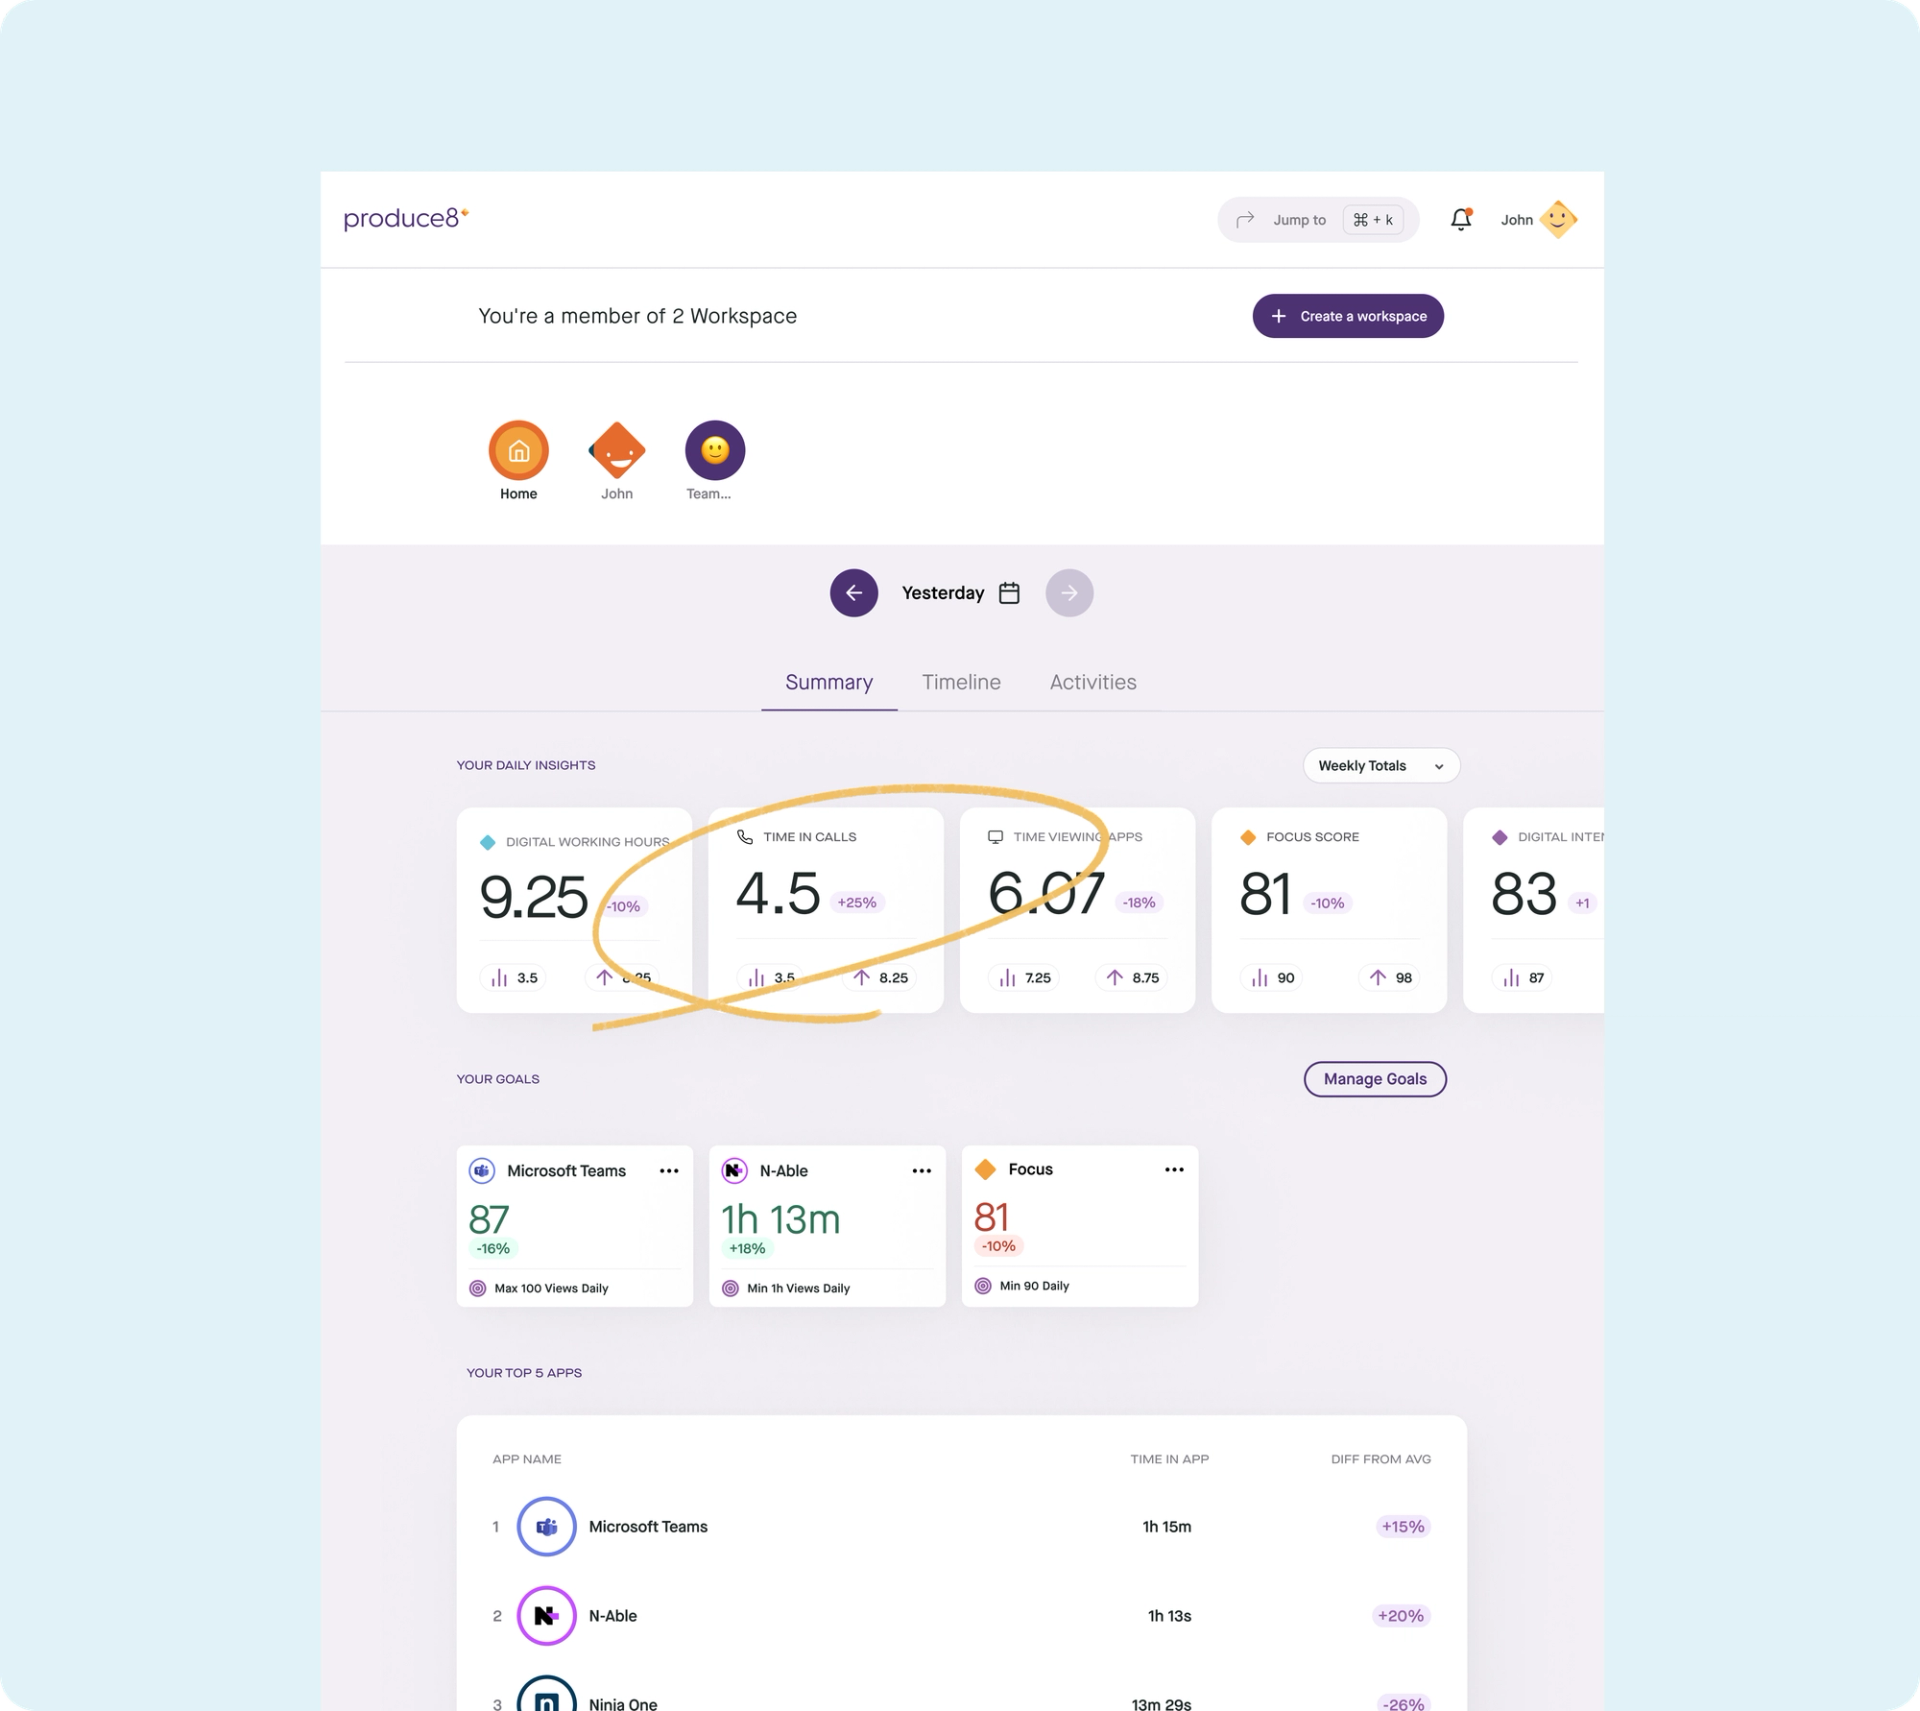
We've incorporated aggregated call data into “Your Daily Insights”, allowing you to see the amount of time you've spent in video calls, huddles, and virtual meetings throughout your day.
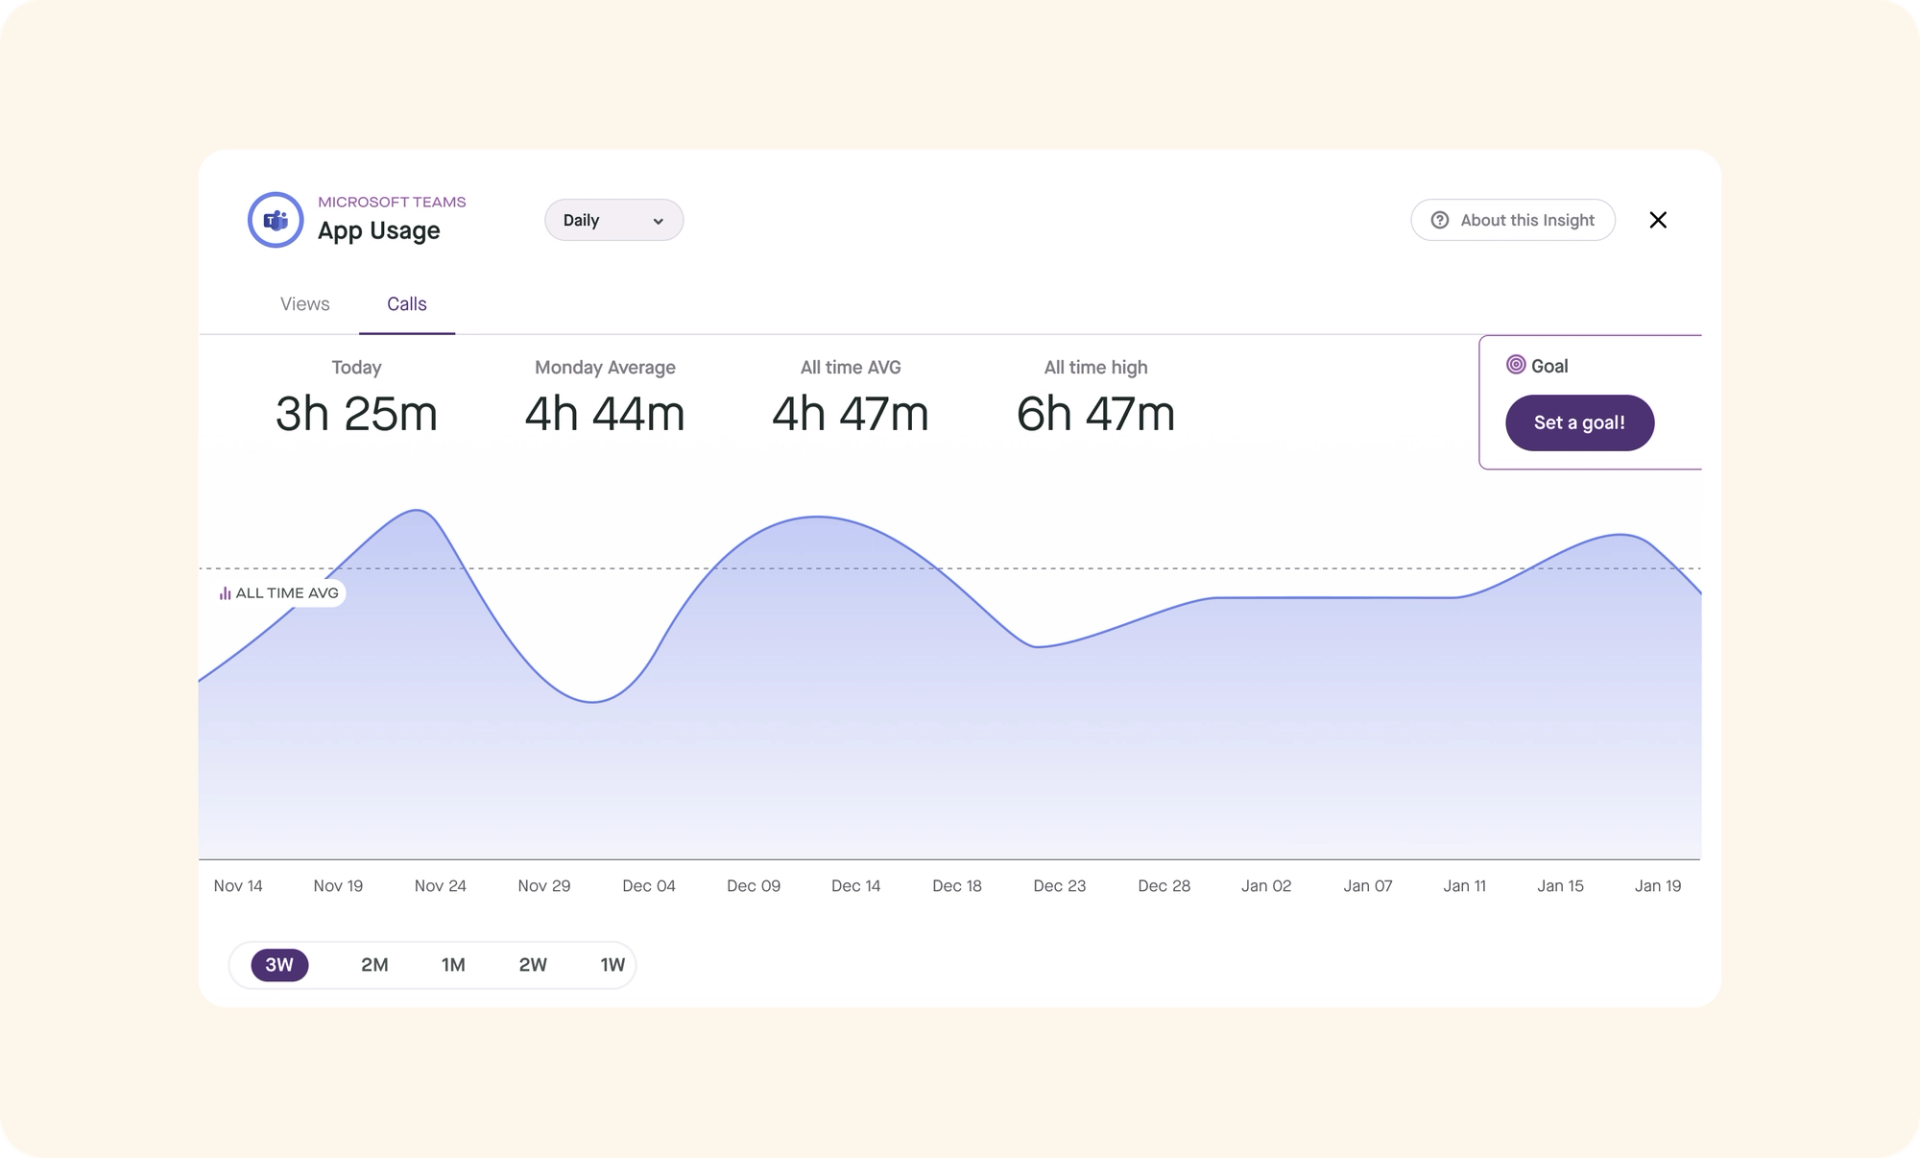
In Produce8, we enable you to delve deeper into your time spent in Calls by providing access to Time Series Data. This feature reveals the amount of time you've spent in calls over longer periods of time.
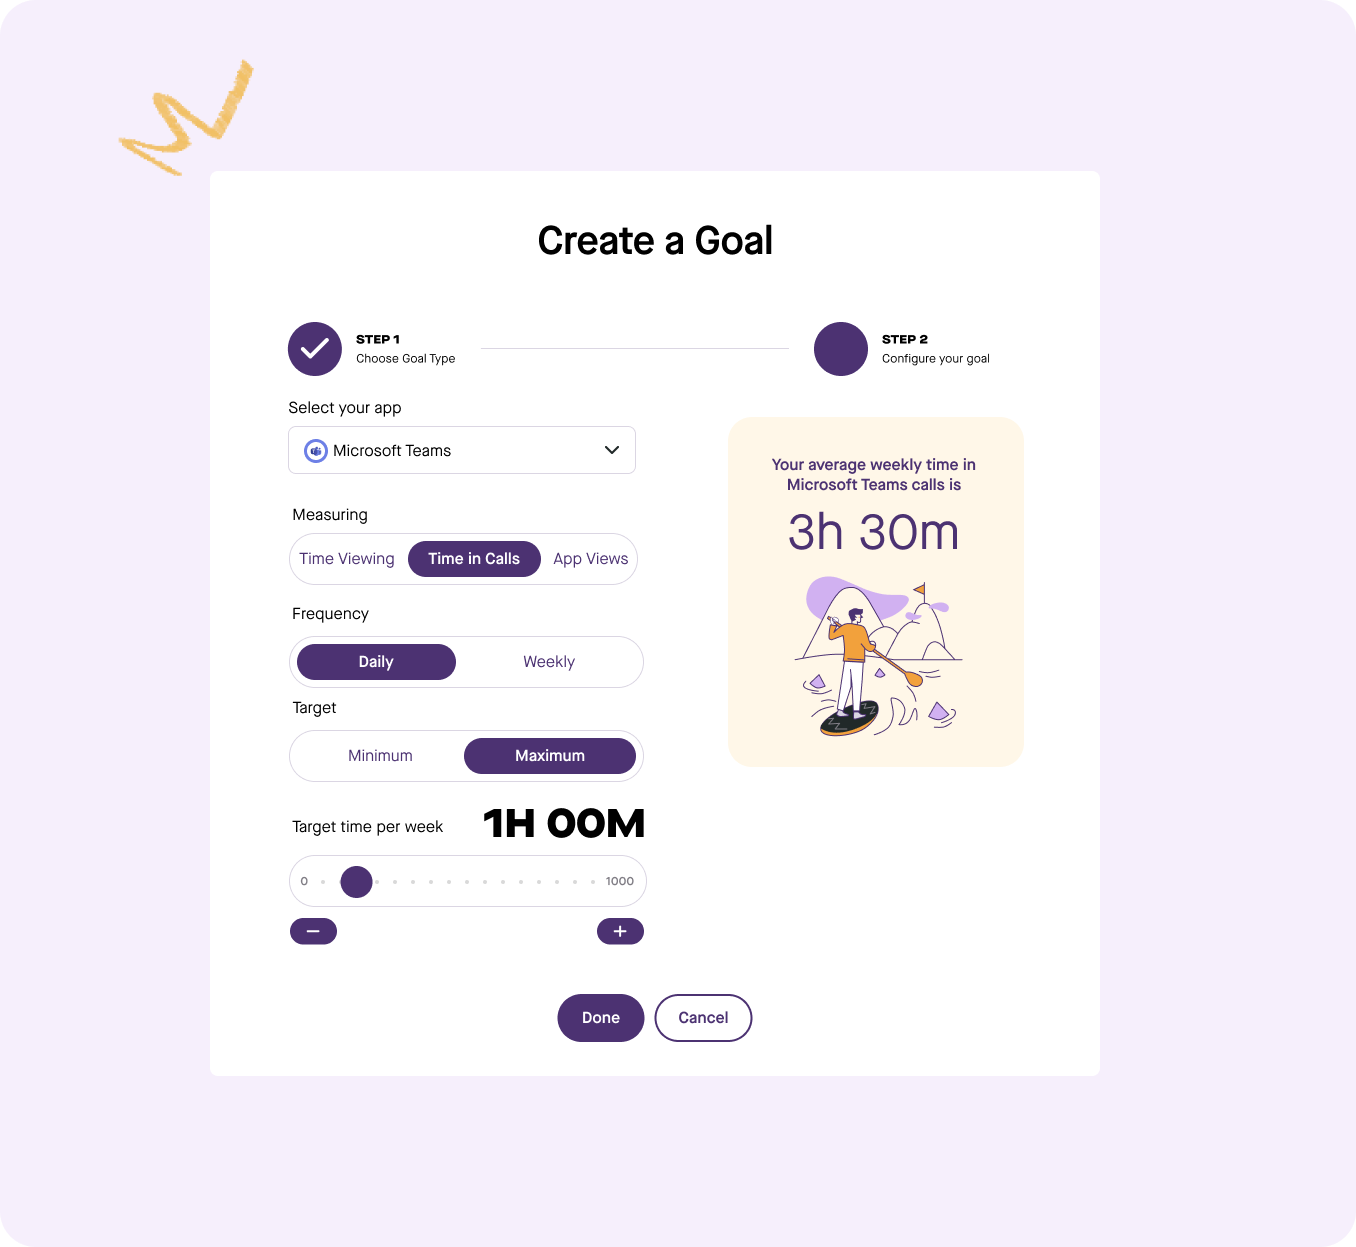
Are you spending too much time on calls? Maintain control over the impact calls have on your day by setting minimum or maximum time limits per day or week in Produce8 “Goals”.
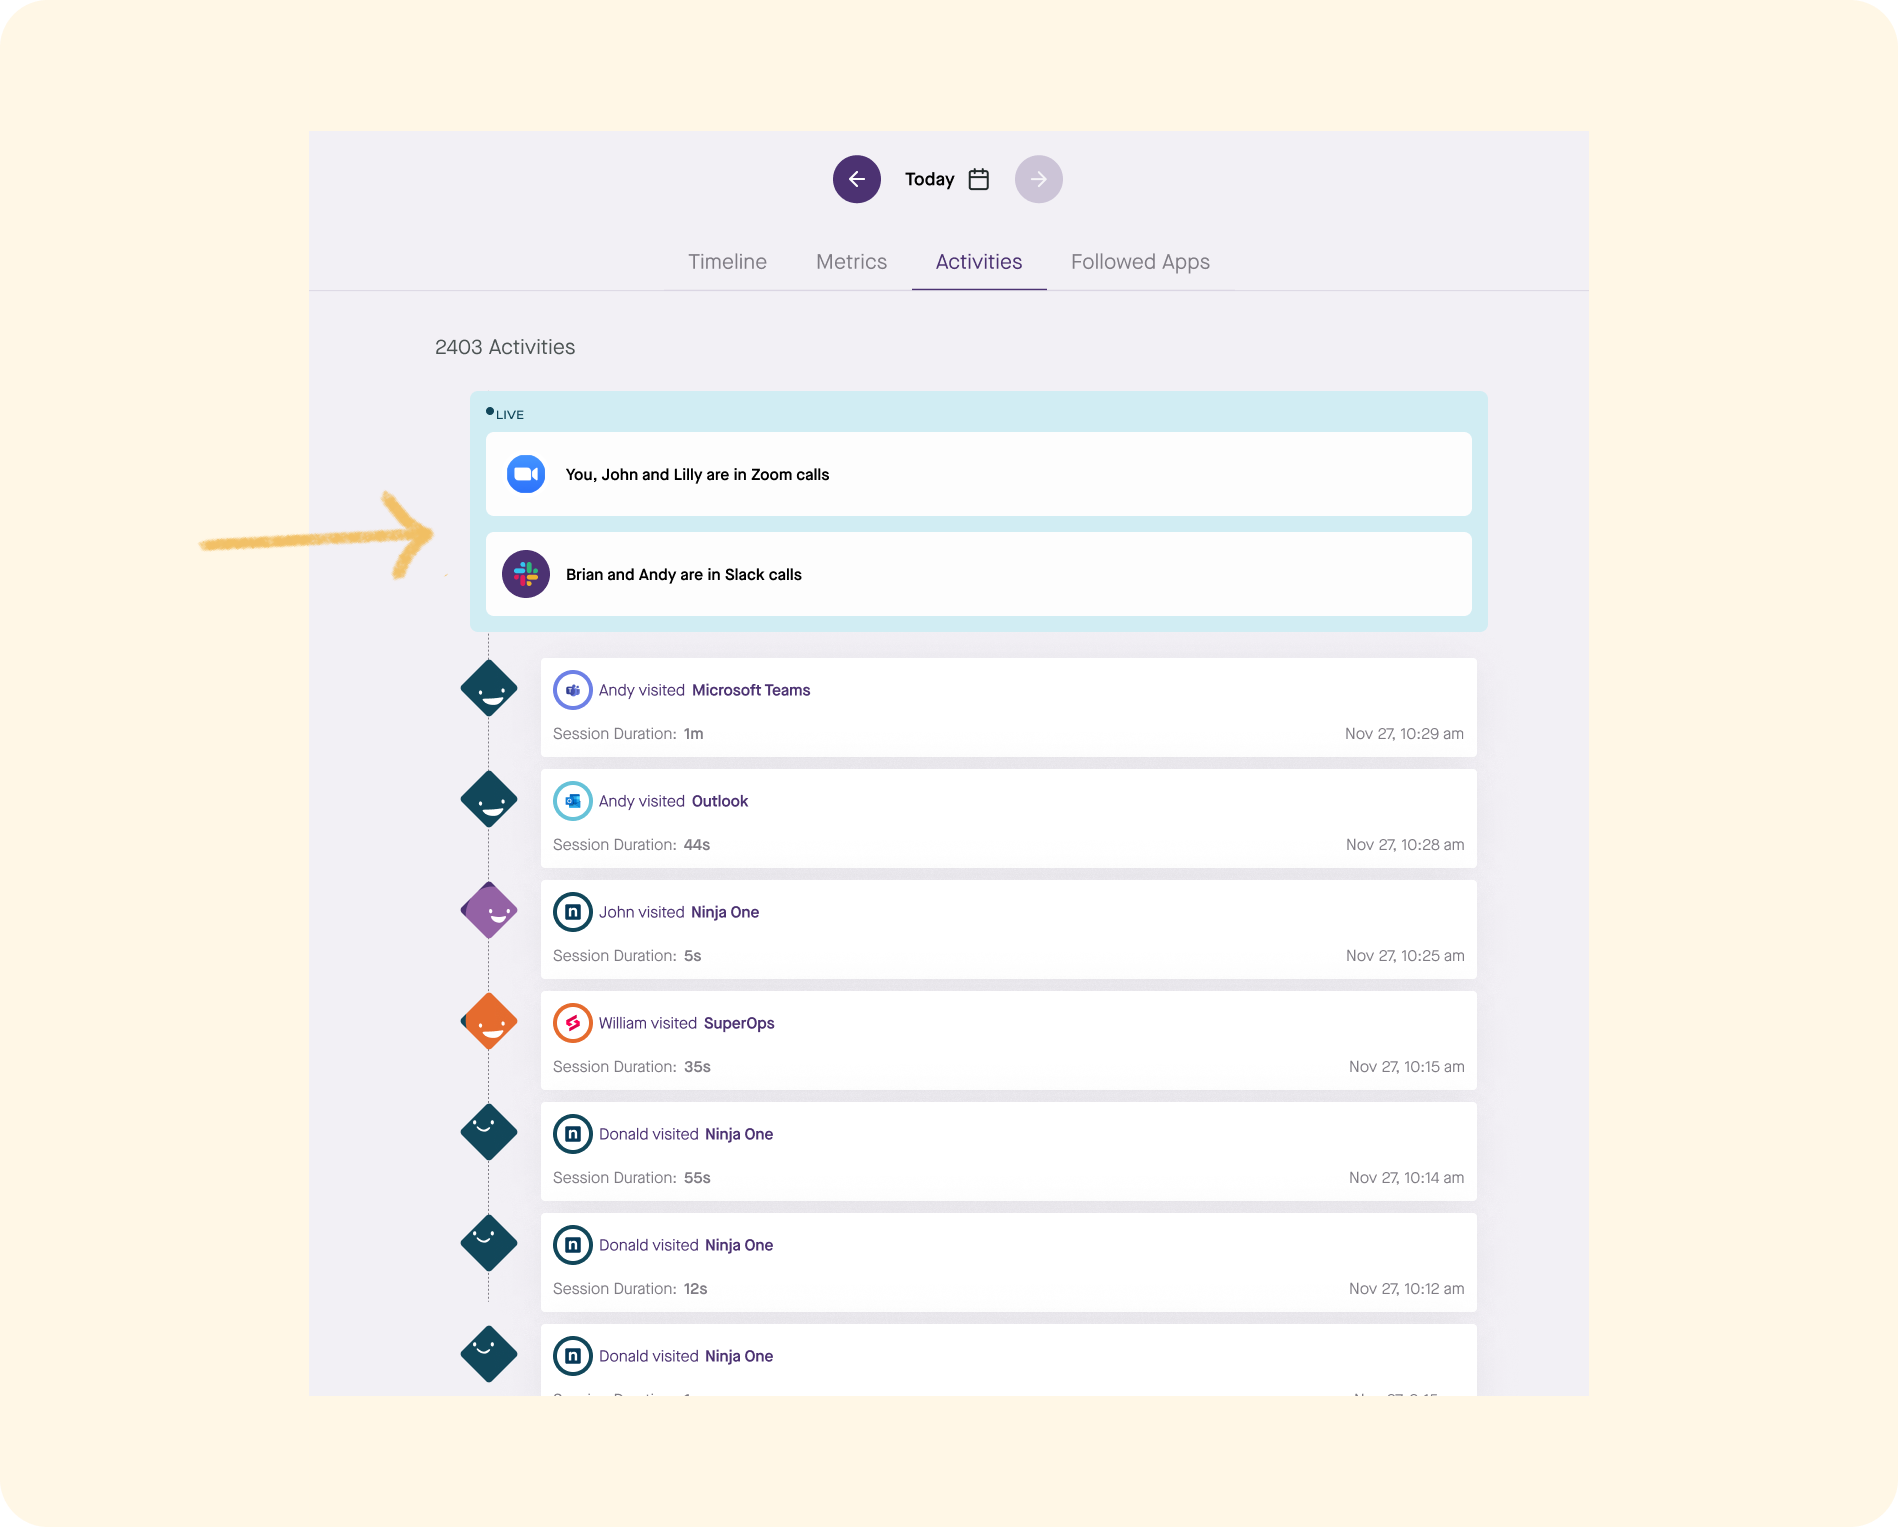
In the Produce8 activity feeds you can see ongoing calls, presented as live statuses while you are in a virtual meeting in Slack, Zoom, or Microsoft Teams. In a shared workspace, that status is viewable for anyone on the team.
You can see two swimlanes on your Timeline: Views and Calls. When Views and Calls overlap, you are interacting with other tools while on a call. This can mean you’re screen sharing and presenting or it could mean you are interacting with other work tools while in a meeting.
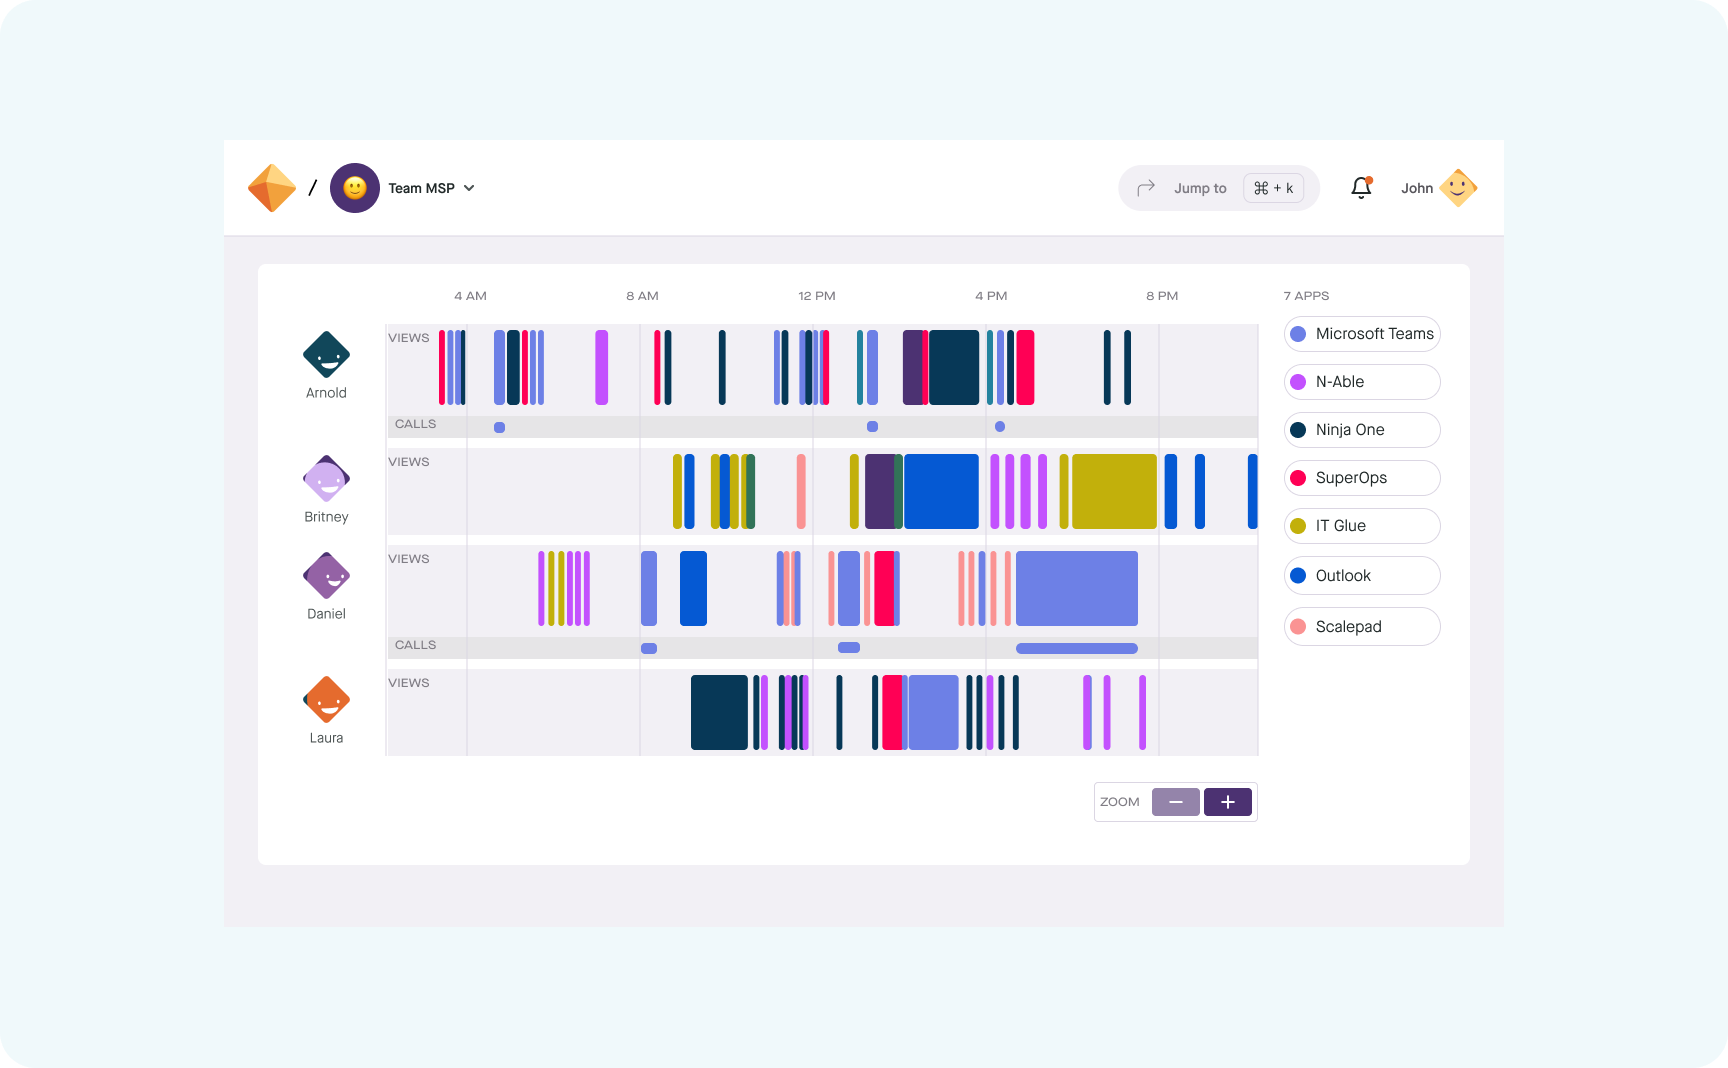
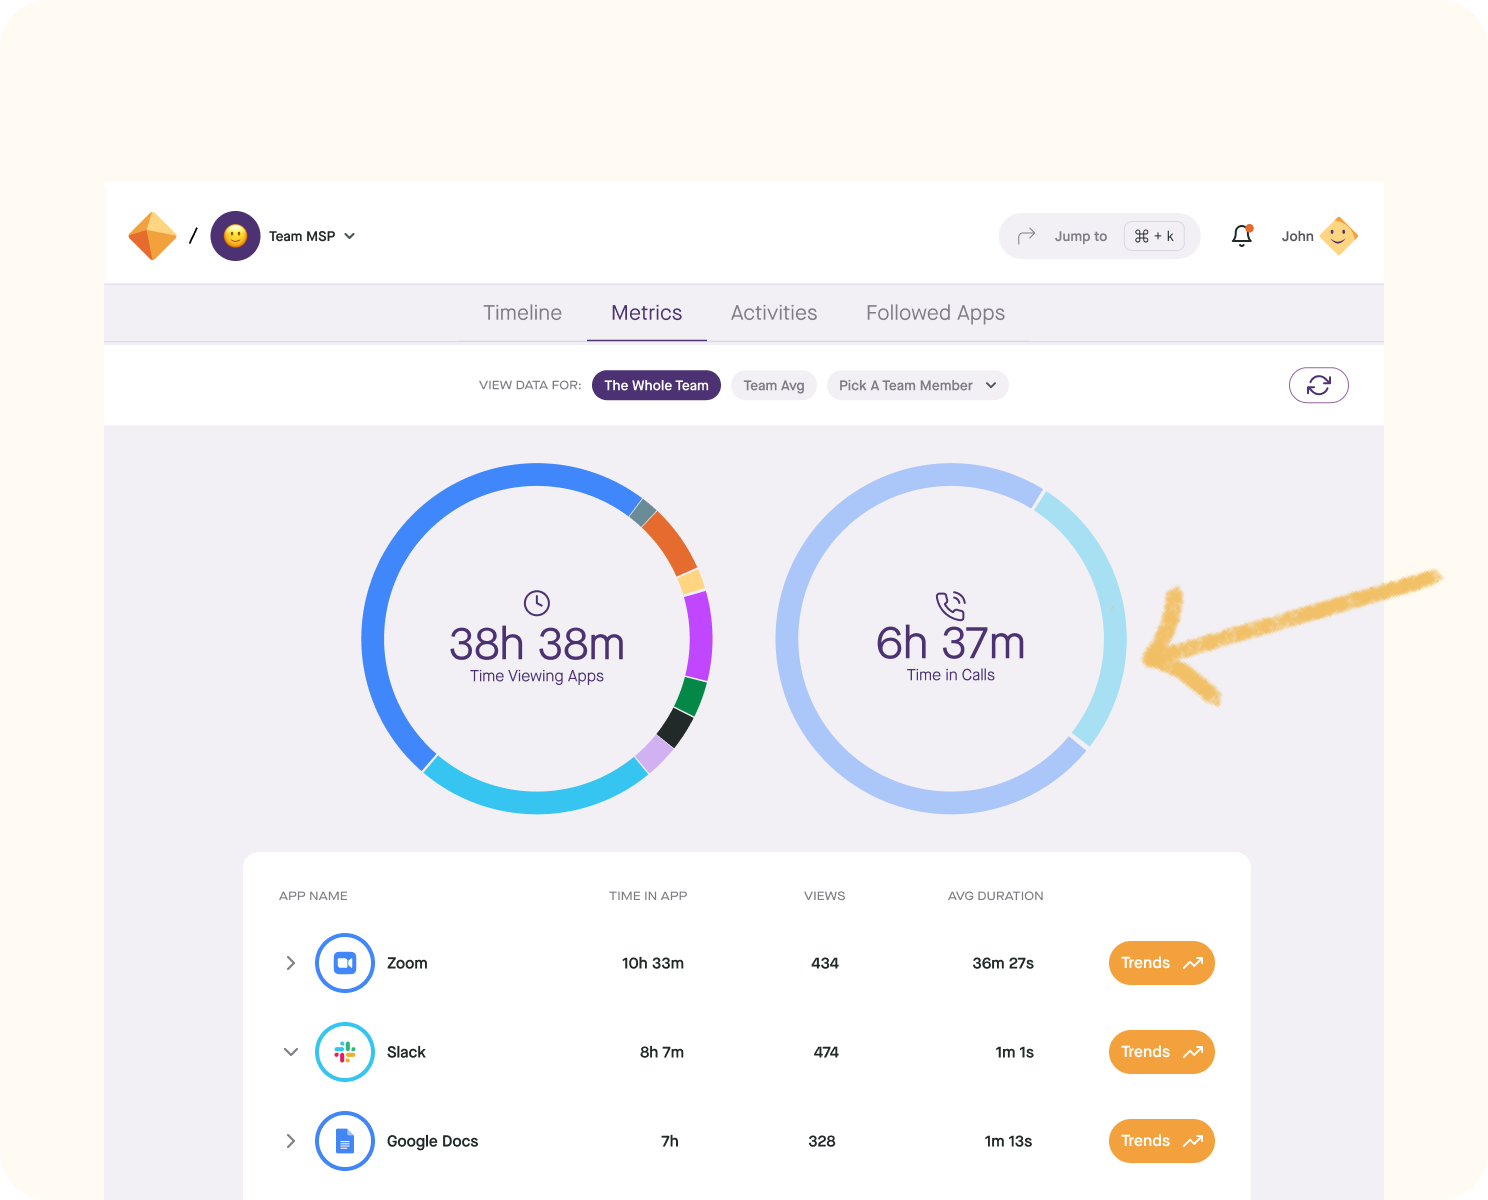
We have also provided you with new calls-related app metrics which include individual data for each of your Apps, including Time in Calls, # of Call Interactions, and Avg Call Durations. This allows you to compare your time on Call in one app with another.
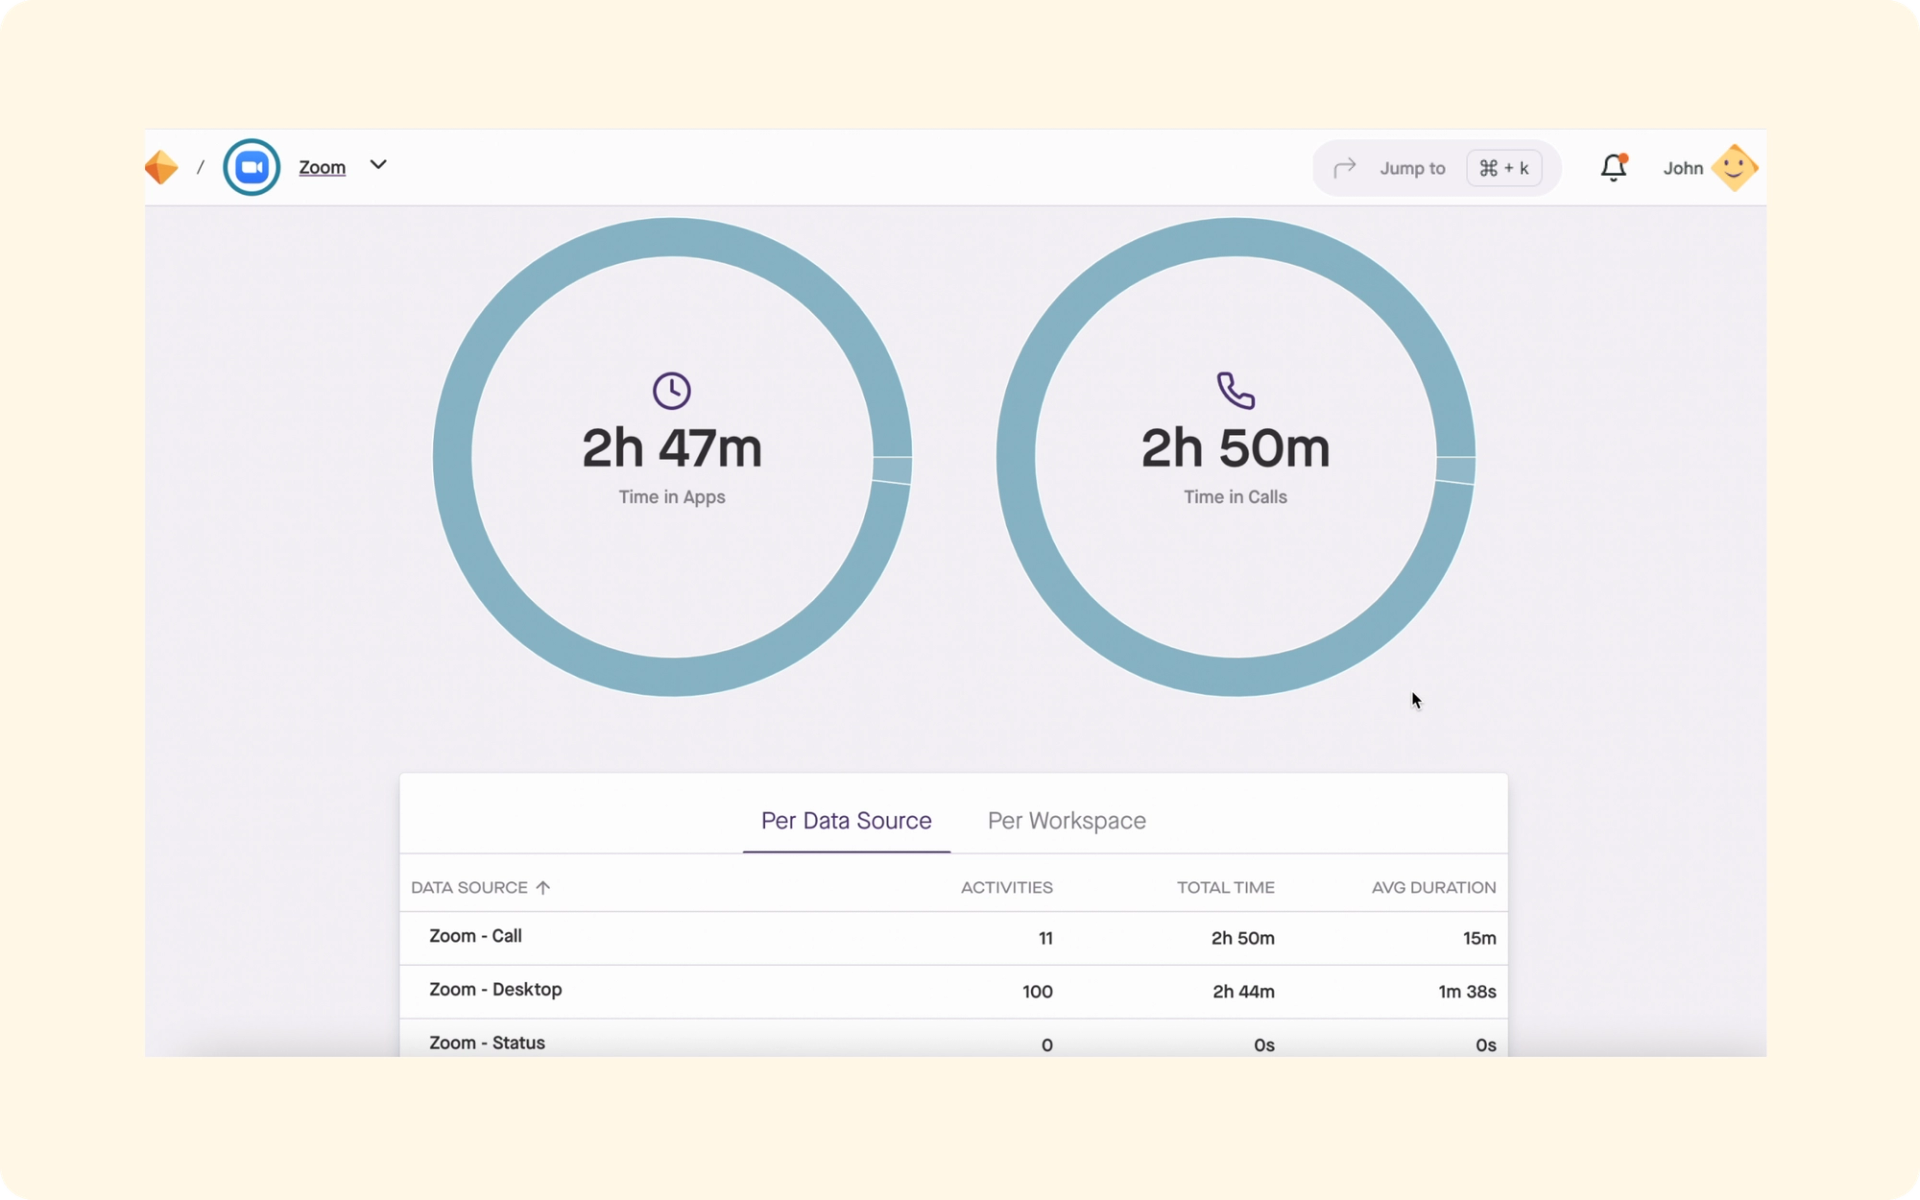
Select a virtual meeting app and you will find App Metrics. Here you find a breakdown of Time in Apps and Calls for Zoom, Slack, and Microsoft Teams independently.
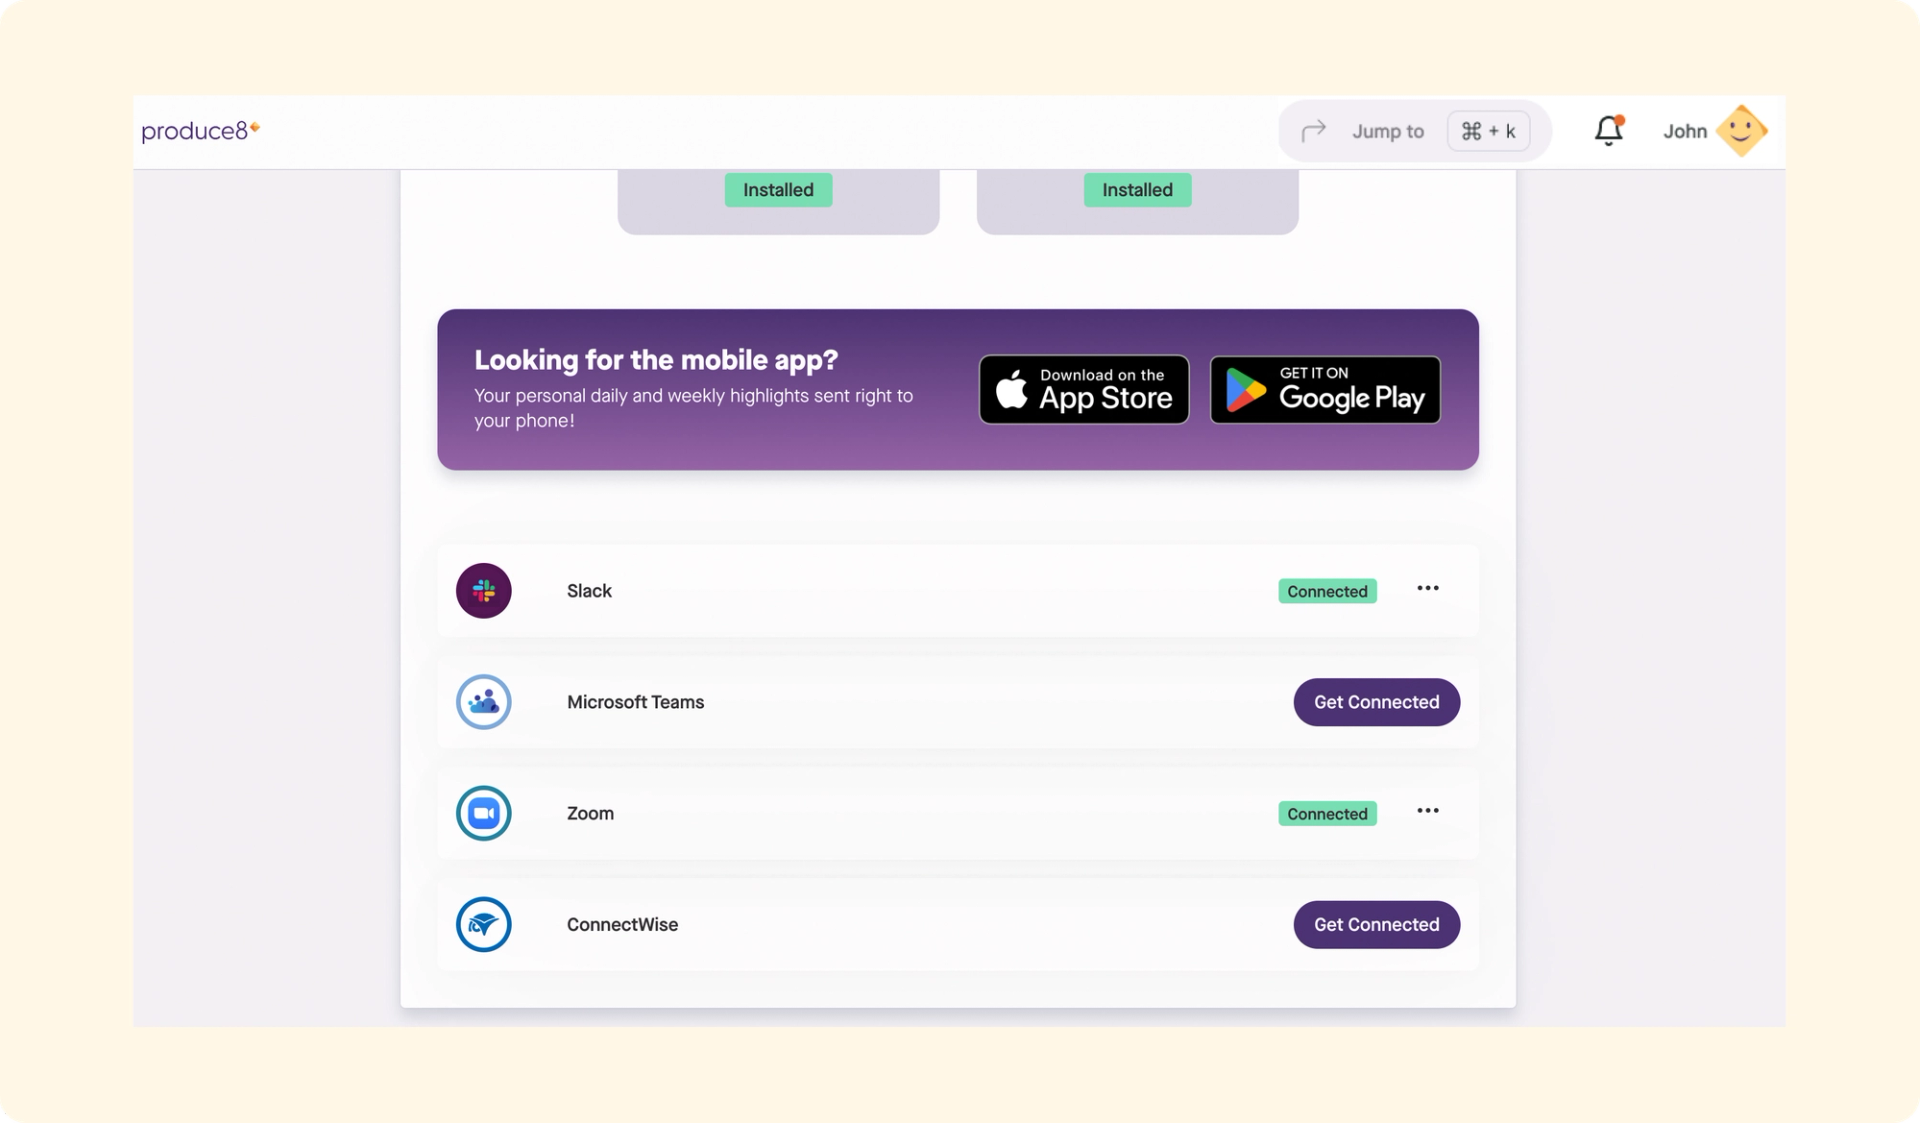
There is now a new authorization flow that helps every user in Produce8 identify themselves in Zoom, Slack, and Microsoft Teams.
Meetings and calls are some of the most time-consuming activities that people engage in every workday, but by understanding how you spend your time on Calls, you can make changes to regain control of your time.
Updated Features
The calculation for 'Digital Working Hours' in our daily personal insights has been adjusted to include 'Calls' data.
New Application Layout
January 21, 2025
Introduction
What’s more exciting than a makeover! After two years of continuous development on our existing UI we decided that the application needed a much more progressive design that better reflects the look and feel of a habit building app, while still staying true to the analytics roots of the application. We were also pursuing gains in application performance and responsiveness. This combination of speed and modern design ensures a smoother, more engaging experience for users.
We are super pleased to announce the rollout of our updated UI. It will coincide with the release of a host of new features both for individual employees, for executives and for IT and business consulting service providers that bring the application to their clients. But for now - let’s just celebrate some Pixels and updated features!!!
Introducing the Improved Produce8 Experience
With this latest release you will see some huge gains in app performance, optimized load times and better app responsiveness.
- With ❤️ from the produce8 team!About This Release
This new feature in Produce8 was built by: Liam, Brandon and Isha
Updated Features
Introducing sidebar navigation to the app is a strategic improvement that enhances both user experience and app performance. This design choice simplifies navigation, allowing users to access various sections of the app more quickly and with less effort, reducing cognitive load and minimizing the number of clicks needed.
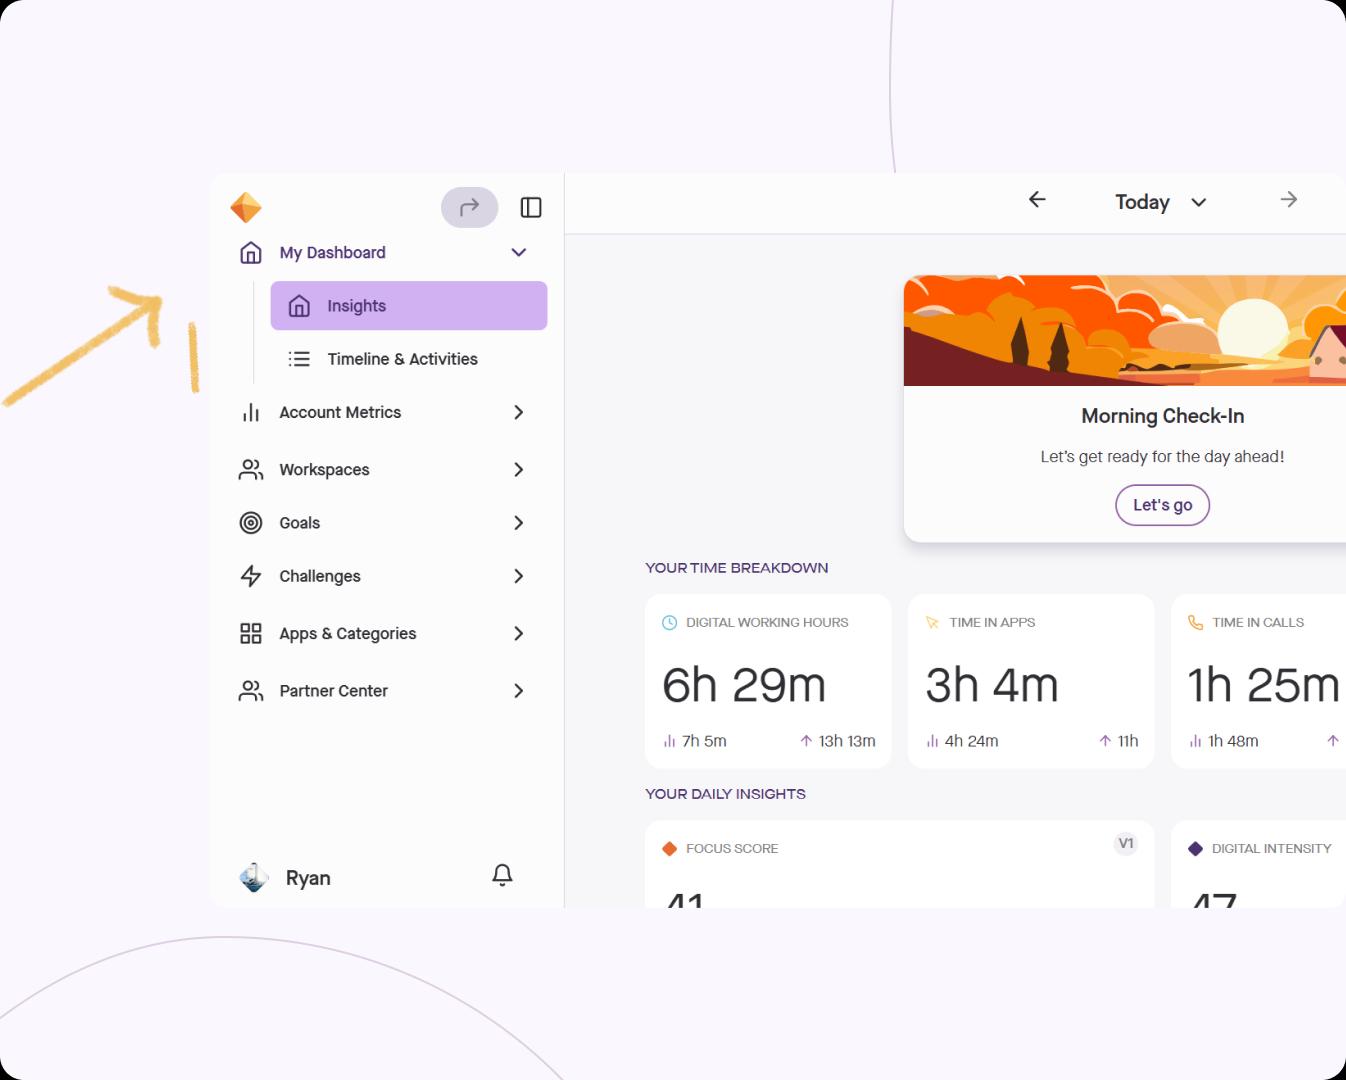
You can access the updated Workspace Dashboard by clicking on Workspaces -> Selecting the Workspace you would like to view the metrics on.
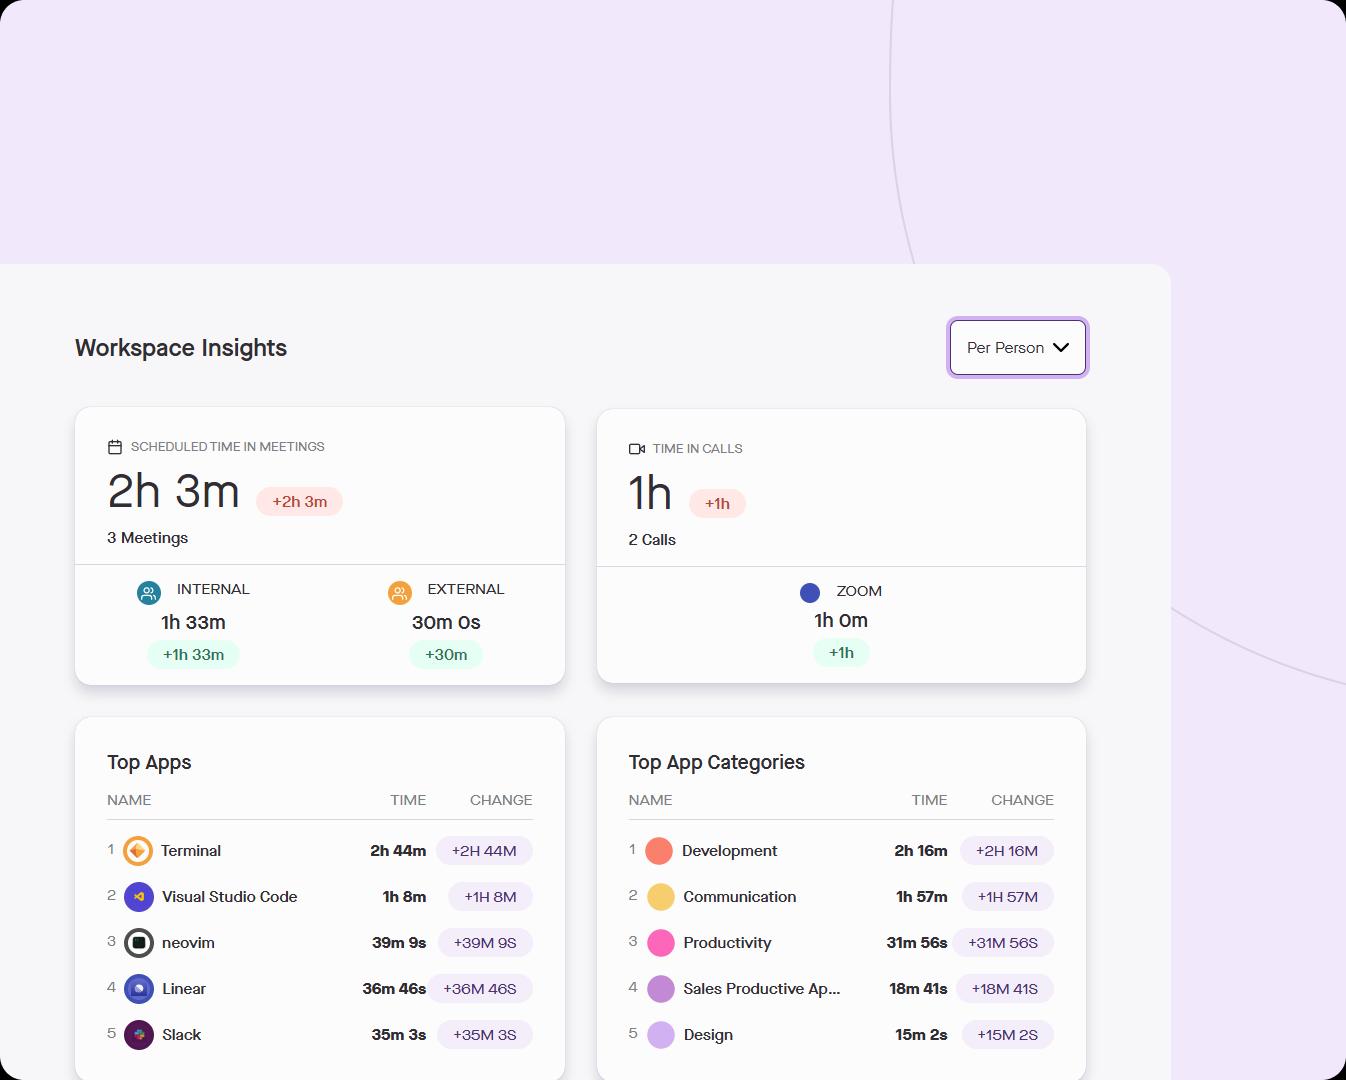
Every workspace will now have its own Dashboard. It will include the following:
- Scheduled Time in Meetings: It will show a sum of Internal and External Meetings.
- Time in Calls: It will show a sum of call events across Slack, MS Teams and Zoom.
- Top Apps: It shows the Top 5 Apps by their View duration.
- Top Categories: It shows the Top 5 Categories by their View duration.
- The data can be aggregated by Day and Week.
Users can view Team Totals and average per person by switching between them using the toggle.
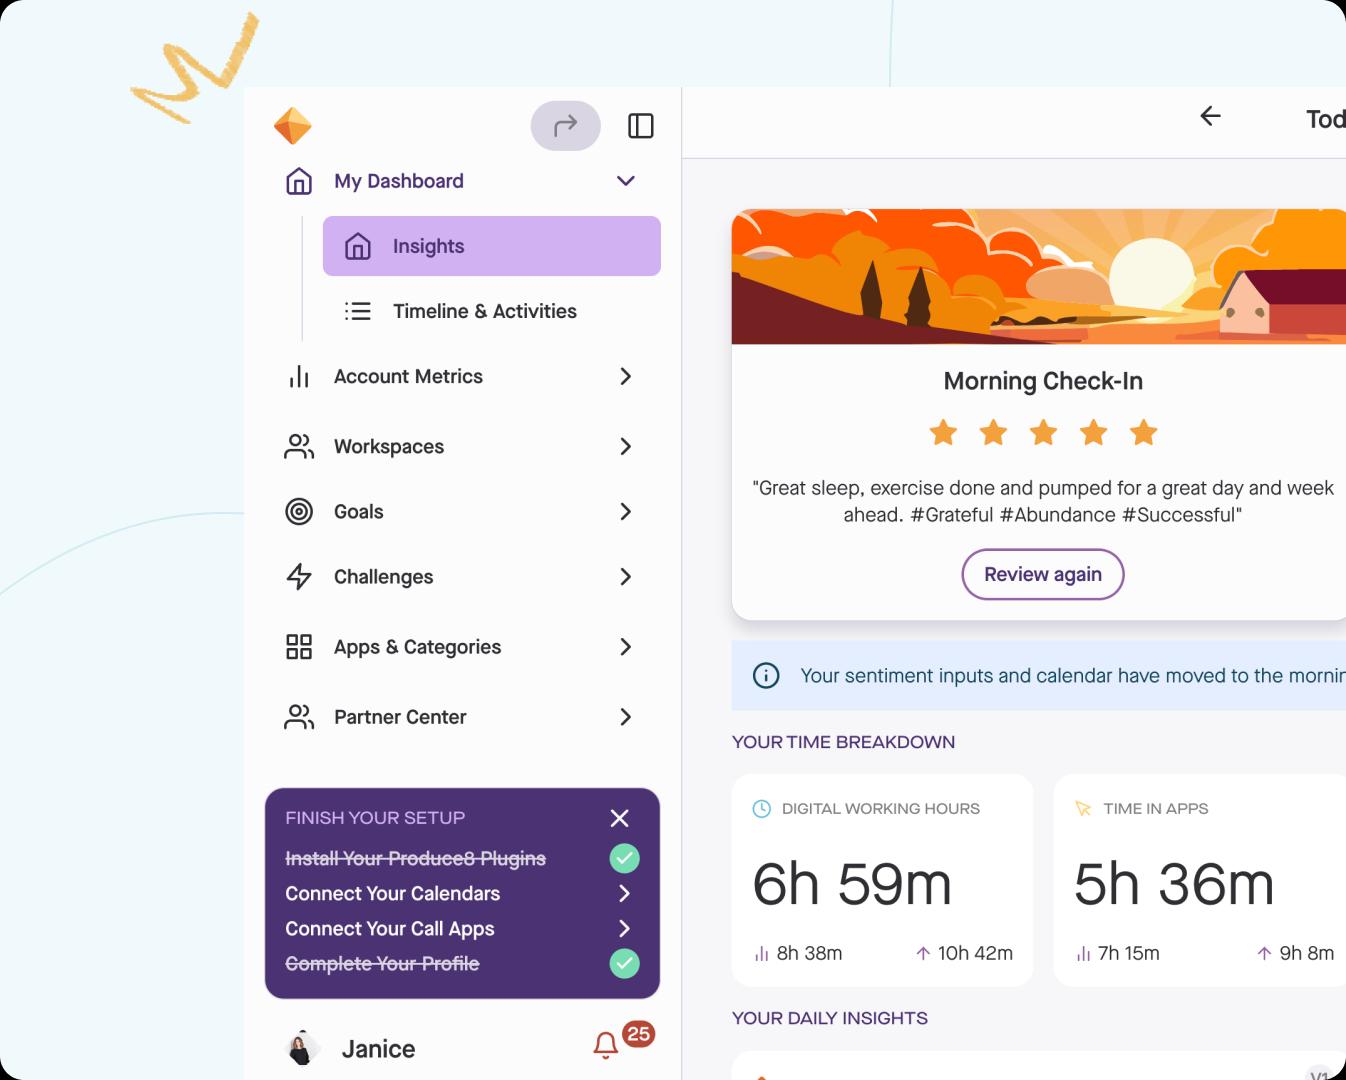
Users will now be able to see a reminder if they are missing connection to any of the following:
- Desktop and/or Browser extensions
- Integration setup if they have any of the call based apps - Zoom, Slack, MS Teams. (Note, if they have more than 1 call app, it will only mark it as completed when all call app integrations are set up.)
- Integration setup if they have any of the Calendar apps
- Profile data for 'Work Location' and 'Job Title'
Clicking on each icon will take you to the page where you can finish setup.
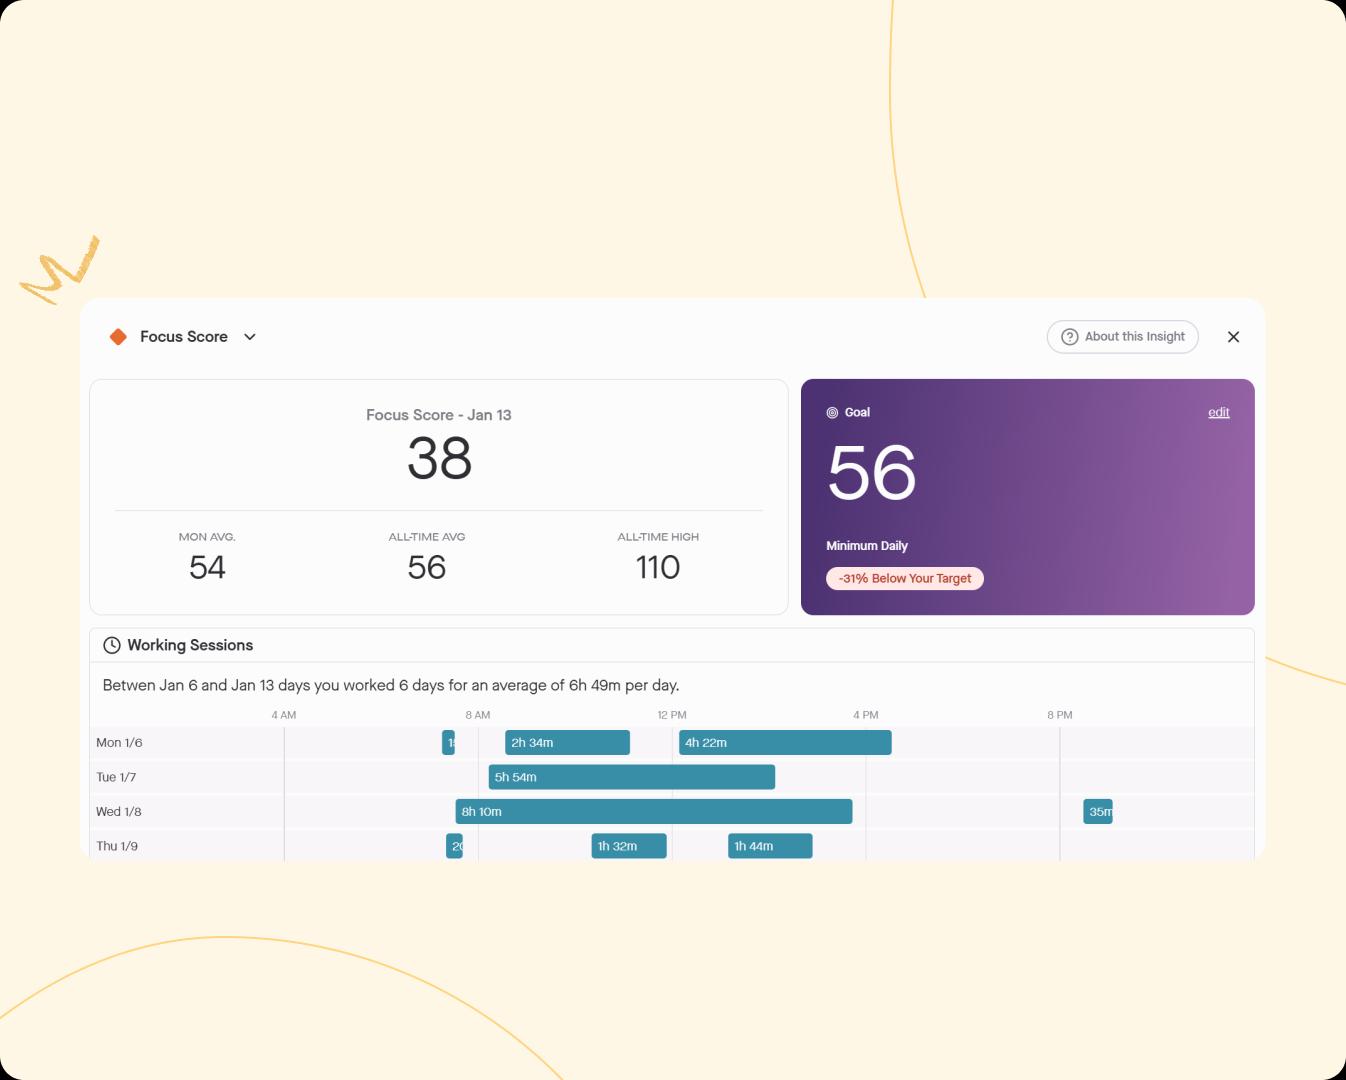
You will now be able to view your working sessions when you view your Focus Score. A working session is defined as a continuous period of user activity, with breaks lasting less than 60 minutes. If there is no activity for 60 minutes or more, the session is considered to have ended.
Produce8 V1.4.2 (Alpha)
May 6, 2021
About This Release
This is a minor release for bug fixes and back-end infrastructure. It doesn't include user-facing features.
- With ❤️ from the produce8 team!Produce8 V1.3.0 (Alpha)
April 15, 2021
About This Release
This is the first release of Produce8 to display the activity stream feature, though the feature has been hidden in 1.3.0.
It will be enabled along with simple ConnectWise ticket KPIs in a future release.
- With ❤️ from the produce8 team!New Features
- Store user theme preferences in AppSync
- 'Team Roles' - display and manage team roles
- 'Expiry on Invitations' - invitations to new team members will expire and can be re-sent.
- Allow users to select their identity in IT Glue
- 'Leave Team' 1.0
Bug Fixes
- Old invite expires gracefully when new invite has been sent
- Intro line of invite reminder email uses the same intro line as new-user invitation email
- Added padding to some UI elements
- Buttons have been moved to show up behind header when scrolling up
- Owner of a team not allowed to be remove unless another owner exists
- 'Change Email' communication now uses right wording
- App no longer gets stuck on loading screen after accepting invitation
- System admins won't see an error screen after accepting invitation
- Invited users now show up in 'Manage Account' view after invite
- Right wording is used when user is not a part of existing teams
- 'Verify My Code' option on sign up is functional
- Users are redirected to desired page on sign in
(This is not an exhaustive list, all bugs related to enabled features are priority)
Major Feature Release: Heatmaps
November 2, 2023
Introduction
How do you normally use your apps? What's changed?
We are very pleased to announce the release of heatmaps for your app usage. What’s a heatmap? Well, we can already show you your app usage across days — allowing you to understand your usage trends — for the apps you want to spend time in and those you prefer to avoid. But what does that look like for the average day over the last week, or for the last three months?
- With ❤️ from the produce8 team!About This Release
This new feature in Produce8 was built by: Jordi, Brandon, Anthony, and Christine.
New Features
Heatmaps allow you to see the pattern shifts inside the day as you work on reshaping your work habits, and the impact on how you use your tools.
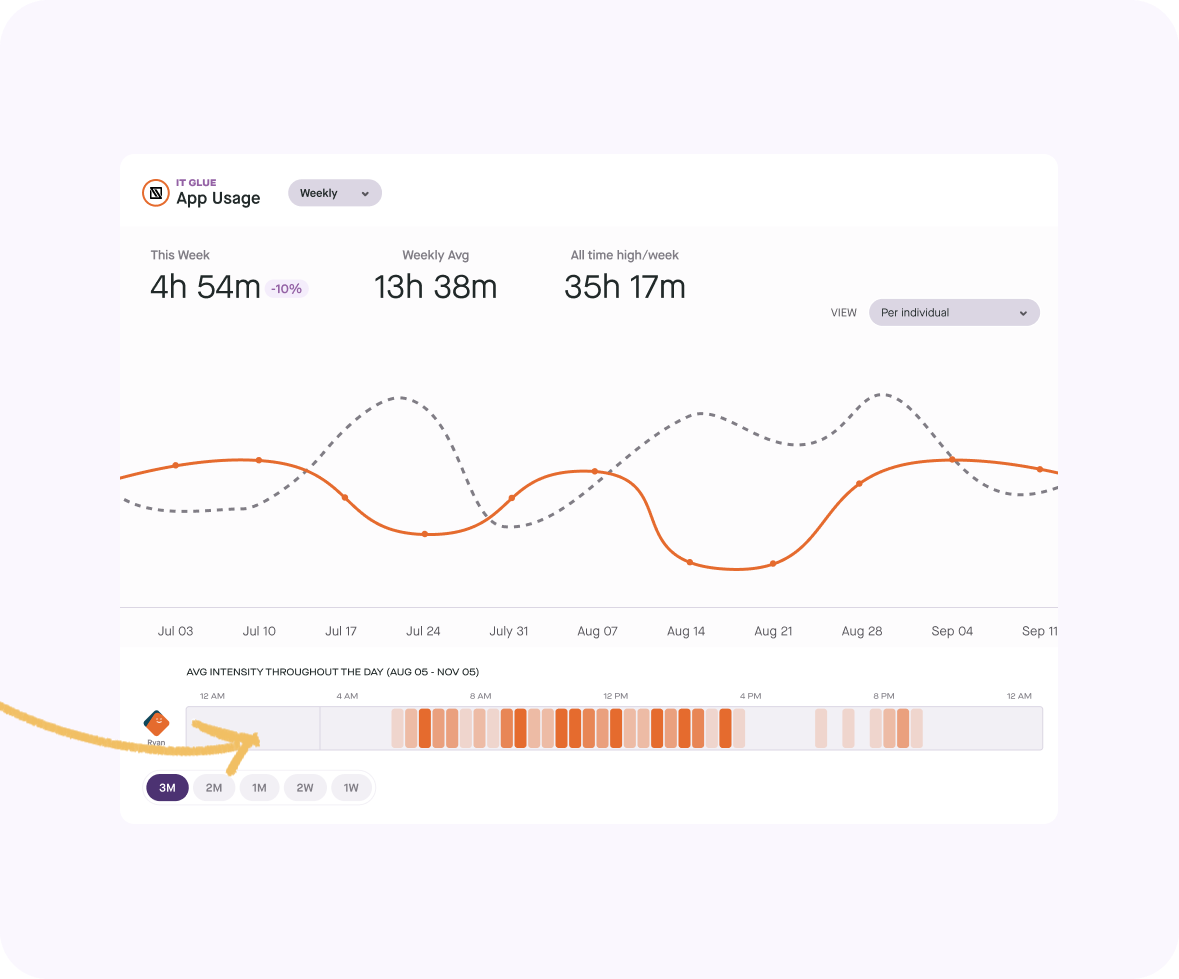
They are particularly interesting when answering:
⌛ Are your morning and afternoon check-ins with your daily plan actually happening?
⏲️ In which part of the day are you collaborating more? What about the rest of your team?
📧Are your efforts to batch your email or job applicant screening time paying off?
❌ What time of day should you avoid booking people for meetings based on when they are usually crushing it?
This is what a heatmap of a productivity hack being adopted looks like. It’s not always a straight line to success. In this case, a daily plan involves a check-in every morning on Mac Notes where this person tracks their plan for the day.
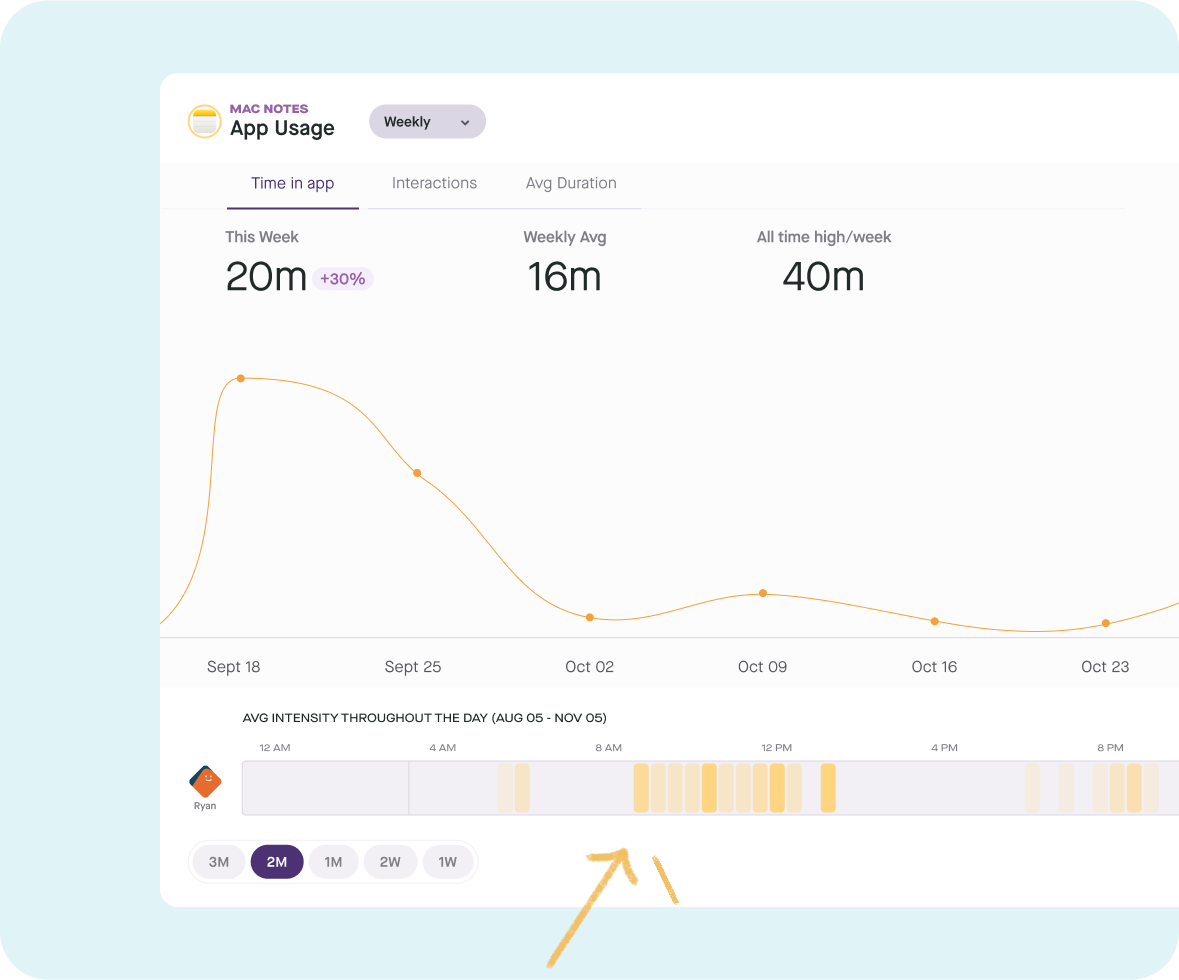
Compared to the weekly app usage time series, you can see it worked, then it didn’t, and now they are getting back on track.
Not every app has a pattern, and even that can be helpful to know. But if you want to work out loud in a team and focus on the app your team uses most, you will start to understand how you all work.
So start analyzing the impact of your personal and team productivity hacks. According to researchers, it takes 66 days to form a new habit. We have you covered with the data to prove that you accomplished it.
Produce8 V1.2.0 (Alpha)
April 8, 2021
About This Release
This release is a precursor to launching the activity stream feature, which enabled a DB to be used to store user activities. Additionally, user enhancements around team management and invitations are included.
This release enables server-side rendering for improved user-experience and load time.
- With ❤️ from the produce8 team!New Features
- Replace Production Warehouse bucket with aurora DB
- DB migrations (manual)
- Roles in team
- 'Resend Invitation'
- Work toggled off for
- integrate ITG and CW data to warehouse
- Move web app to use SSR functionality
Bug Fixes
- Cannot invite team members in app
- New email not reflected after change email
- Non-ConnectWise user can't get past invitee onboarding
- Progress indicators on subscriptions
Produce8 V1.0.0 (Alpha)
March 11, 2021
Introduction
Produce8 helps teams improve performance by bringing together the activities taking place in their business applications into one place so everyone can see how the work is going.
You are part of an invitation-only evaluation of Produce8.
- With ❤️ from the produce8 team!About This Release
In the alpha version of Produce8, our focus is on getting one team set up, starting with an admin. A Service Delivery Manager will then be invited to enable the integration to ConnectWise and O365, sending invites to the team members and onboarding those new users into the app.
You won't see a lot of features or data in here yet and the application will appear quite raw from a design standpoint.
Thanks for taking part. We look forward to collecting your ideas for our next set of features.
New Features
- 'Create New Company Account'
- 'Select Team Name'
- 'Invite System Administrator'
- Connect O365 to get team members
- Connect ConnectWise and 'Select Subscriptions' - no data will be displayed
- 'Invite Team Members'
- 'Team Member Sign Up'
Produce8 V1.5.9 (Beta)
January 24, 2022
Introduction
- With ❤️ from the produce8 team!About This Release
This major release introduces data filtering, a new timeline view and a new metrics view. There is an update coming for a bug that's causing missing and shortened events.
New Features
New team timeline view
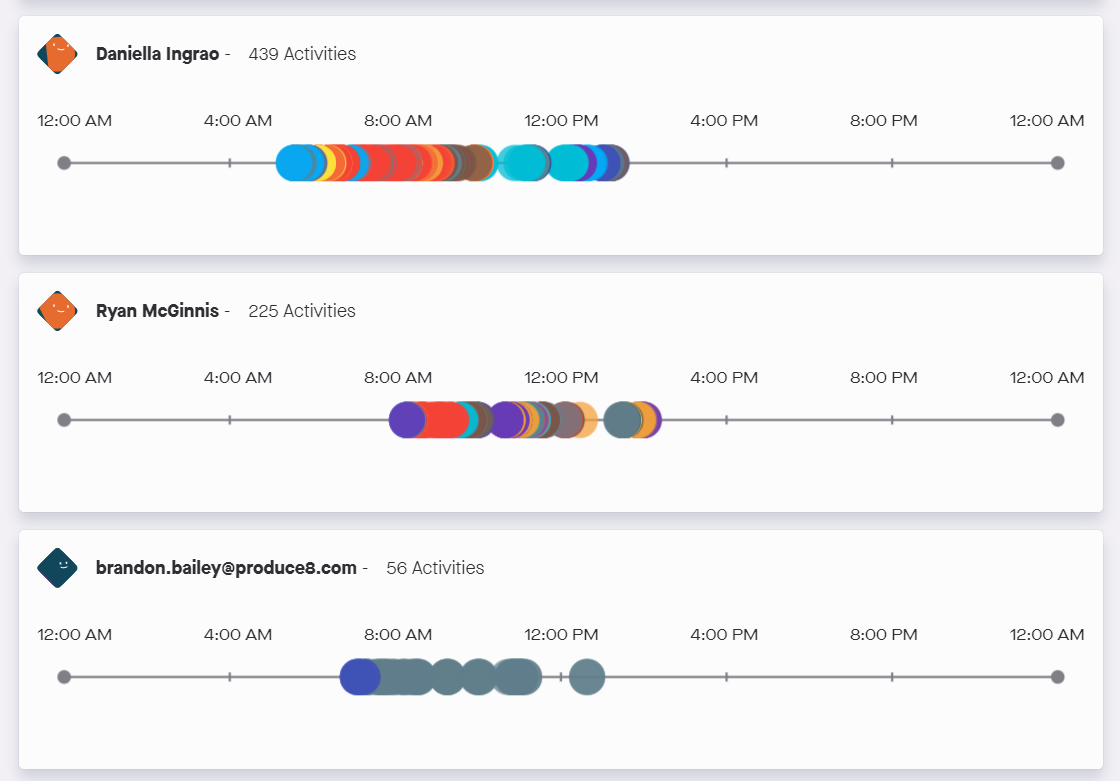
We've finally launched the side-by-side team timelines! We've been talking about this one for a while, but first had to build out some better filtering to make it possible.
This new way of viewing user timelines enables side-by-side comparisons to get a better sense of how your co-workers work and to help them understand the same thing about you.
TIP: Our team has found this very helpful for multiple time zones as it gives a sense of the hours in the day where collaboration can occur.
Metrics pie charts
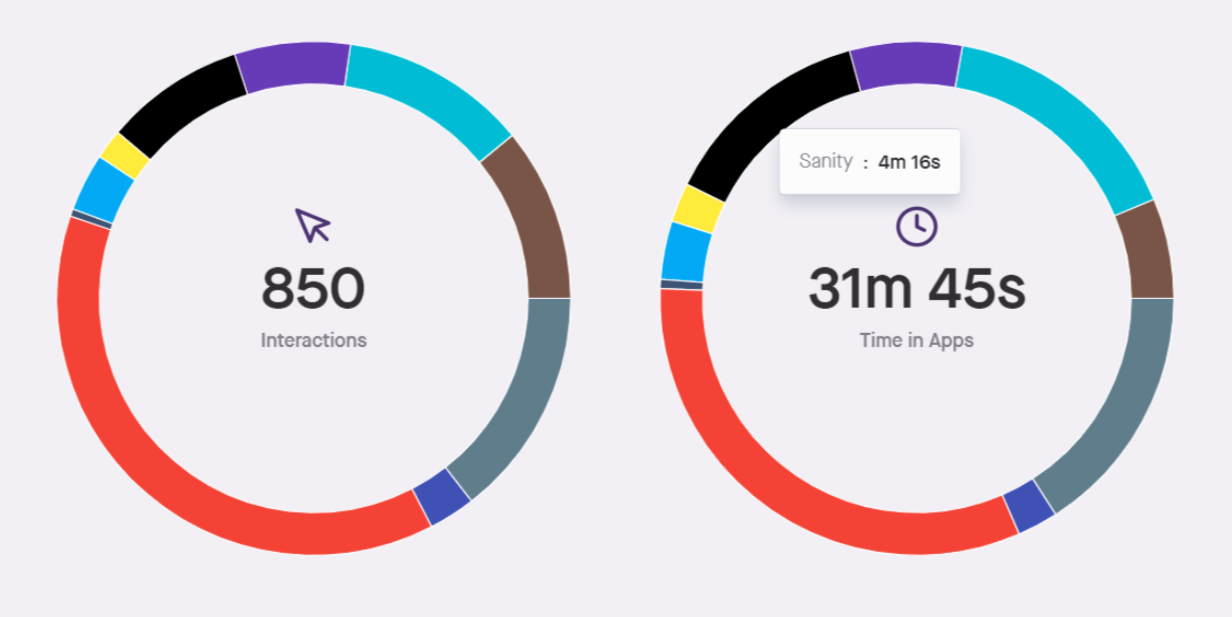
This is a completely new view of app metrics. When we first started talking about what Produce8 metrics could be, this was the very first chicken scratch founders' wireframe.
From a team perspective, this is a great way to understand your most valuable apps. When looking at others or yourself, this helps you understand your power apps and where most of the day is spent.
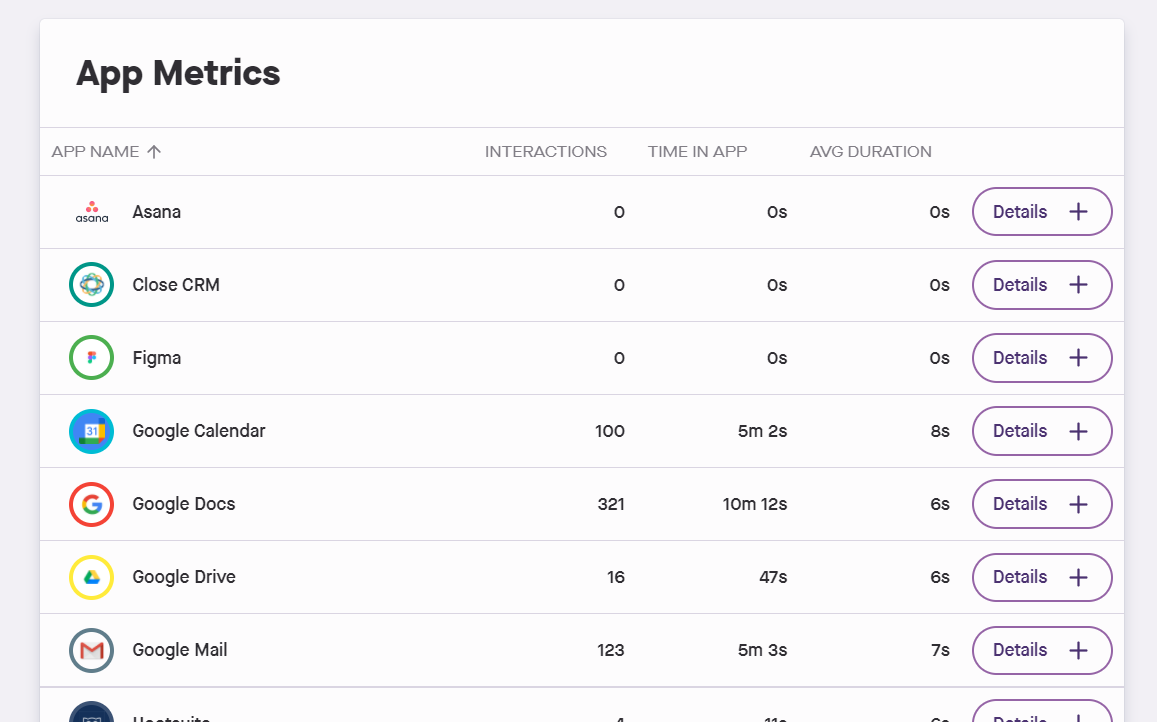
Metrics applications summary dashboard
We've replaced the tiled app utilization metrics with a table view. It consumes less space in the UI and summarizes the data in a way that's easier for users to interpret.
You can expand and collapse each app to view the subscriptions that drive them.
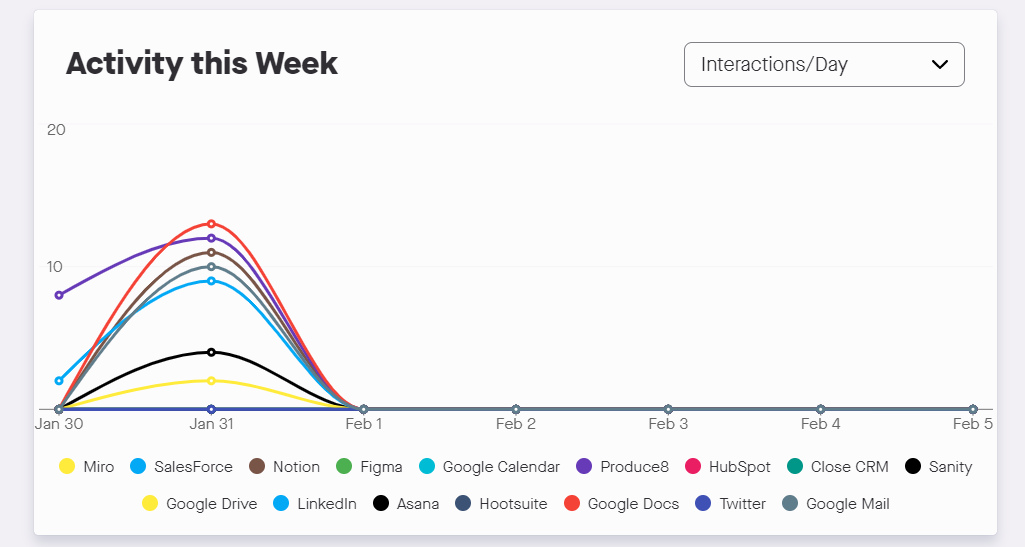
Metrics trend charts
The first version of trend data is out and it looks slick. This offers a better way to visually display app usage over time. You can view the chart based on:
- time per day
- interactions per day, and
- average duration.
We're looking for feedback on this feature, so please reach out and comment. We're currently working on a lot of performance improvements to make rendering elements like this faster.
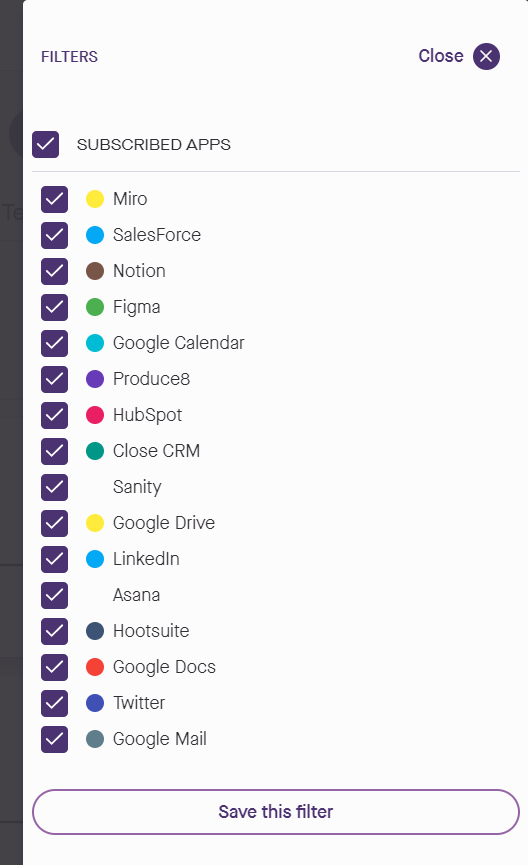
Timeline and activity stream filters
If your team is using a lot of apps and has a large number of subscriptions, you'll want to use the new filters to isolate the items you really want to see.
From either tab, select the filter button and de-select the items you don't want to see. You don't need to save as they are applied right away.
Filters can be also now be saved to persist your view preferences so that you can eliminate the noise from team subscriptions that you, personally, don't really care about. The next time you log in, the saved filters will still be applied.
Finally, filter out users if you want to remove them from the team view.
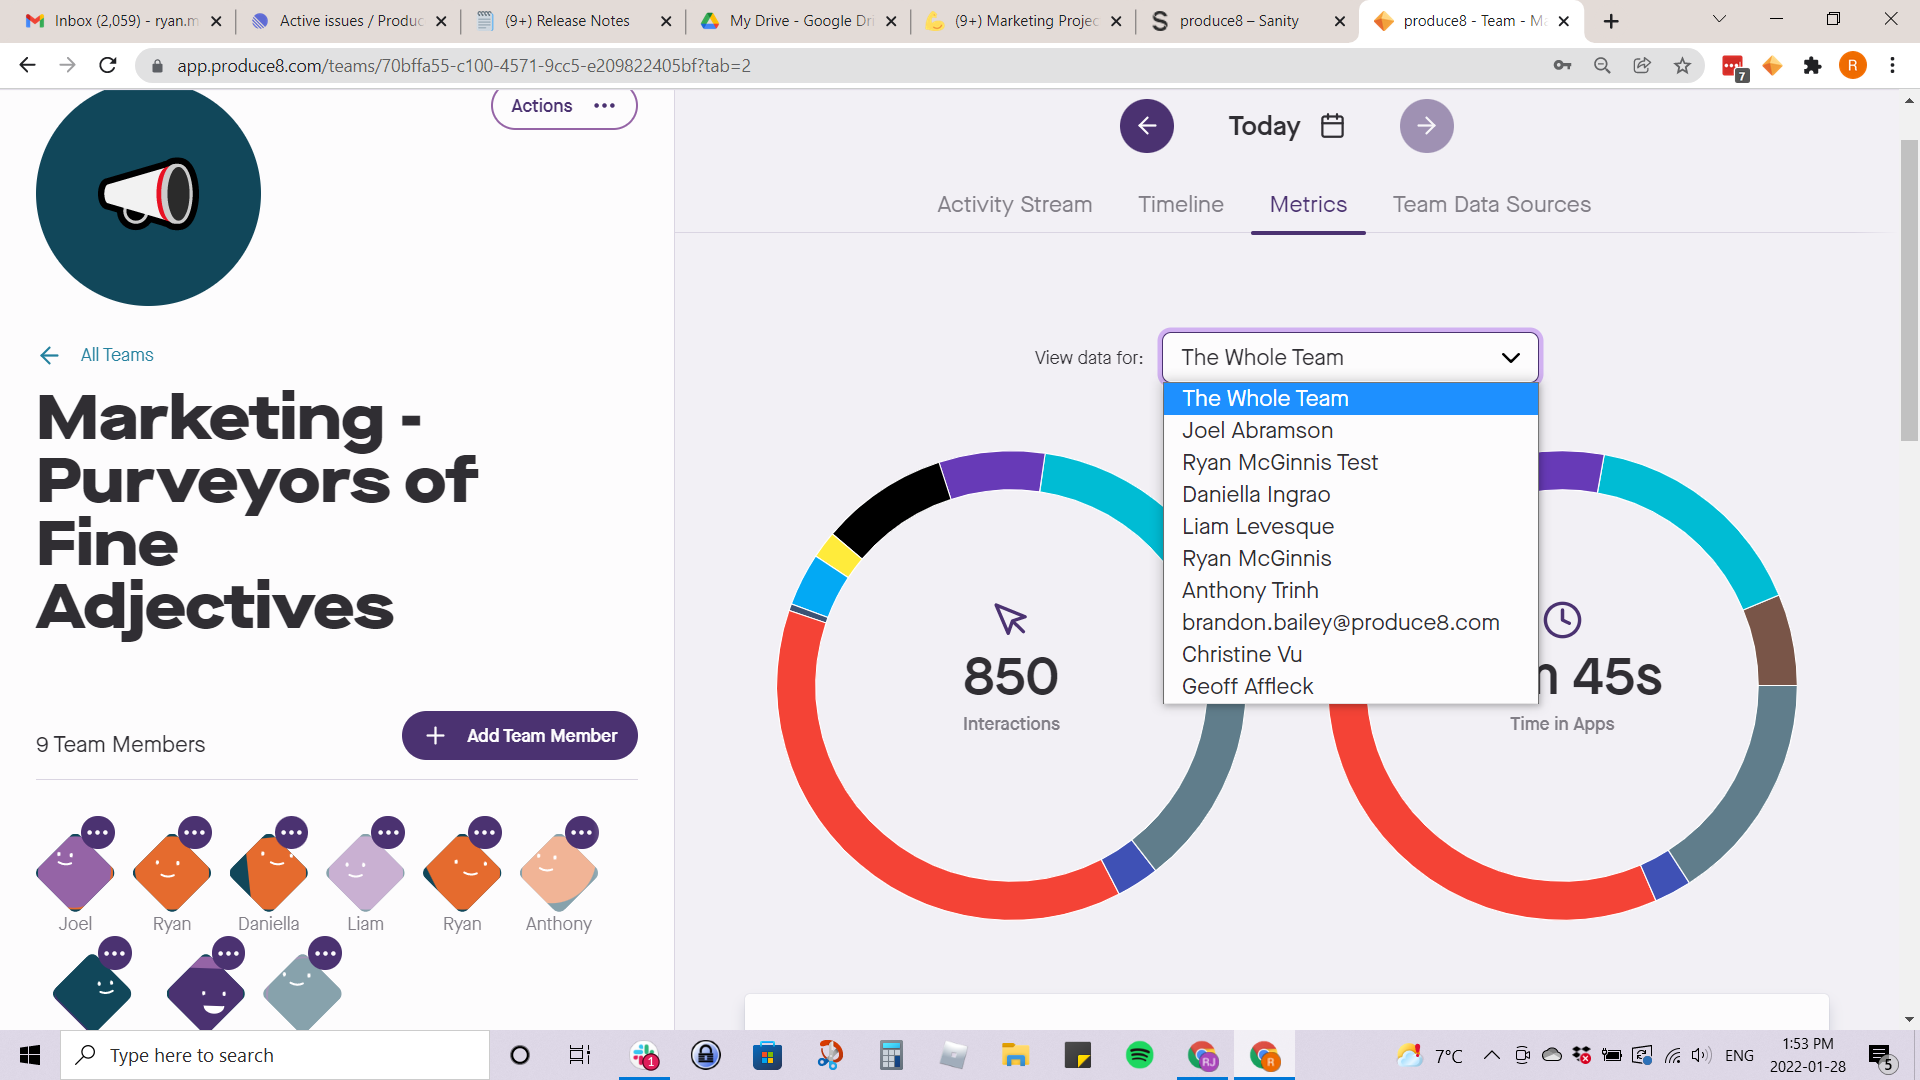
Metrics - filter selection for user or team
We introduced a drop-down to allow you to toggle the metrics for individual users or the whole team.
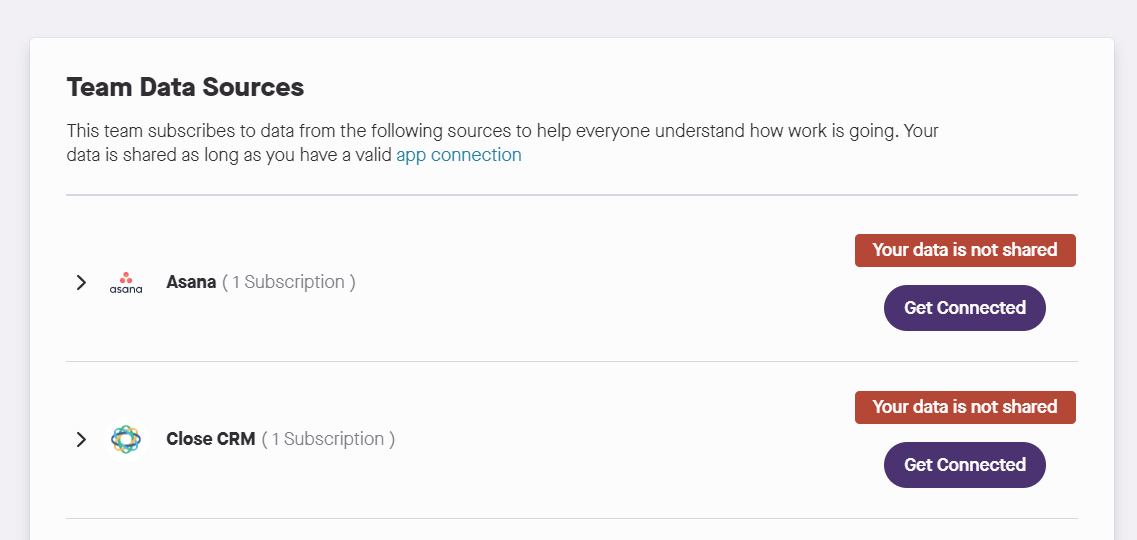
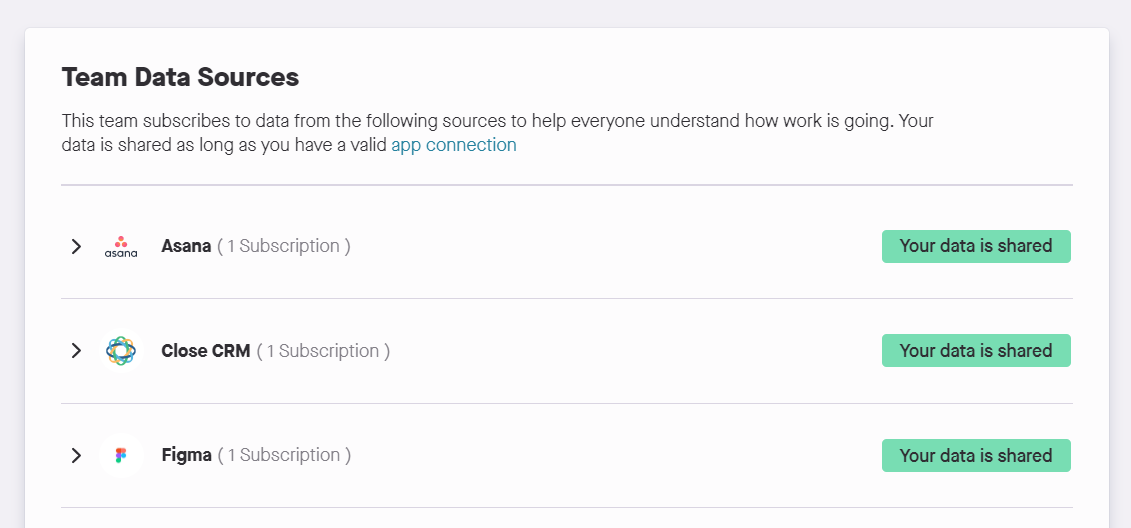
Prompt user to add a data source used by the team
We want to help users understand if and where their data is being shared and what to do if it isn't. We now show a prompt in the Team Data Sources for anyone who has an app to authorize.
Known Bugs
High frequency of inaccurate or missing events (PRO 1069)
During production testing, we noticed a high-priority bug that has been causing events to go missing (around 15%) or to display shorter durations (similar % of events).
We have decided to roll back to a previous code version that will effectively address this issue in the short term, but will cap app events to 60 per user per hour. A longer-term fix is coming in the next month with a very significant architecture upgrade.
Some activities aren't showing up in a logical location on the timeline (PRO 1058)
For weekly views of a team or user's timeline, some activities aren't showing up in logical places on the timeline.
Produce8 V1.4.6 (Alpha)
June 10, 2021
About This Release
This release introduced some minor features and addressed minor bugs in the UI.
- With ❤️ from the produce8 team!New Features
Team emojis
We've given users the option to choose an emoji to represent their team to help distinguish teams from one another.
Bug Fixes
Page requiring refresh for interaction
Each screen/page needs to be refreshed before any of the interactive elements on the screen are clickable. Buttons and text boxes aren't clickable until users refresh the page.
UI stutters when selecting 'Configuring Integrations' during onboarding
Various UI bugs on small resolution screen sizes.
Produce8 V1.4.1 (Alpha)
April 29, 2021
About This Release
This release has enabled ConnectWise ticket activities and metrics as well as IT Glue daily user-summaries.
- With ❤️ from the produce8 team!New Features
Enable the activity stream for ConnectWise tickets
Support for ConnectWise tickets in the activity stream was delivered in a prior release. We've toggled on this feature and are now returning richer data
Enable metrics for ConnectWise ticket 'close' events
When tickets assigned to a user are closed, they'll show up in the metrics tab as tickets closed. Future releases will add more ConnectWise metrics.
Activity stream pagination to display up to 50 results at a time
When viewing the activity stream, we want to limit the requests to a reasonably small number and allow the users to load more results when they reach the bottom of that set.
Calendar and time ranges for event filtering
We wanted to make it easy for users to select specific dates and data ranges to filter results in the application.
IT Glue integration
The new version of our integration for IT Glue will pass through daily IT Glue summary metrics. It will show these in the metrics view of a Produce8 user.
The IT Glue metric tile will appear under the ConnectWise tickets closed metric. If there's no data available, it will appear as N/A. If there's an error, it will show up in red with an error icon.
Bug Fixes
Show activity time stamp in user's local time zone
Fix metrics error when no data is available
Produce8 V1.4.5 (Alpha)
June 3, 2021
About This Release
This was a minor release addressing profile editing and bug fixes including the following:
- Verify ConnectWise subscription status
- Updating team name
- Email change confirmation
New Features
Use new ConnectWise subscription
The ability to verify if a ConnectWise connection is valid.
Produce8 V2.0.0 (Early Access)
July 7, 2022
Introduction
This is the most significant release yet for Produce8. It includes a significant redesign of the application’s architecture to allow it to be more performant under complex subscription, authorization, and event filtration.
- With ❤️ from the produce8 team!New Features
Enhanced personal activity feed detail
You can now see the exact app URL you visited for each event that appears in your timeline. You cannot see this same detail for other users. This is one of the first new ‘personalization’ features we plan to roll out.

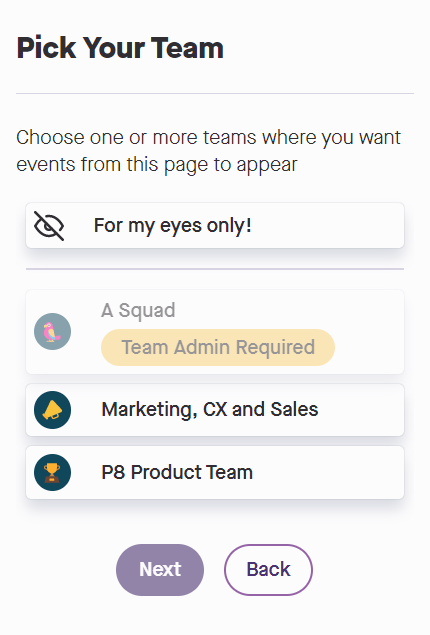
Personal subscriptions ‘for my eyes only’
Users have the option to create subscriptions to apps that only they are interested in keeping track of. Events will display in their feed but not in their teams’.
Sharing subscriptions between teams
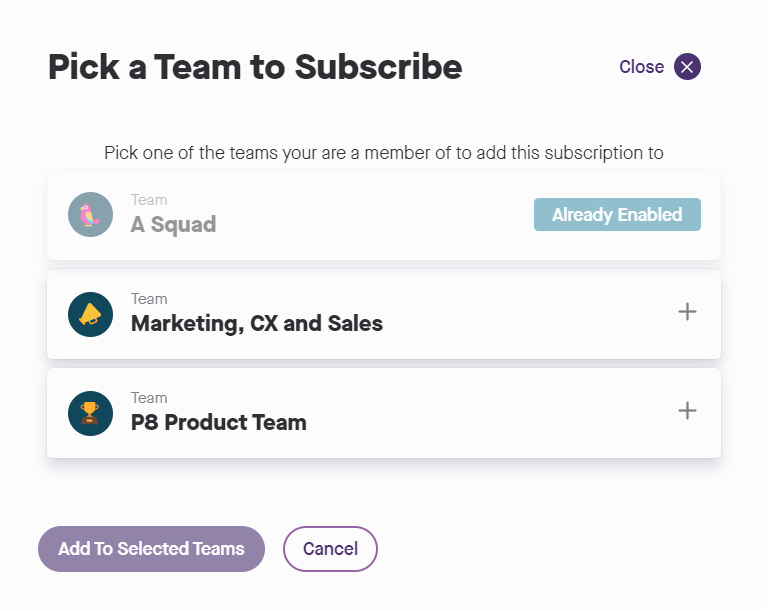
If users want to add the same app subscription to more than one team, they can now add it to multiple teams. This avoids having to create multiple copies of the same subscription. Users can also view and add app subscriptions already used by other teams in their account from the Manage Apps page.
Account app metrics
Have you ever wondered how heavily a SaaS app you manage is being used? We now roll up anonymized metrics at the app level so users can see how teams are leveraging their tools. This is particularly helpful data for SaaS admins, so once you start adding subscriptions to apps, add the admins for those apps too. App ultilization is data that is pretty hard to come by.
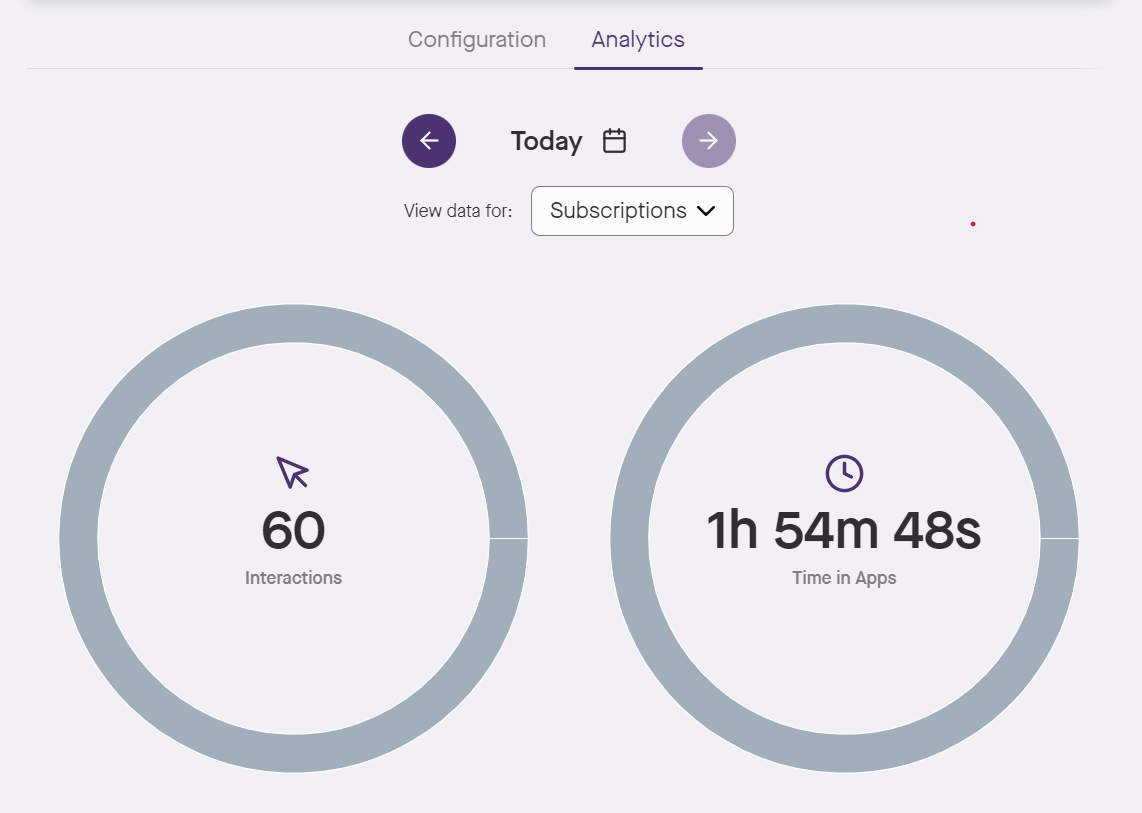
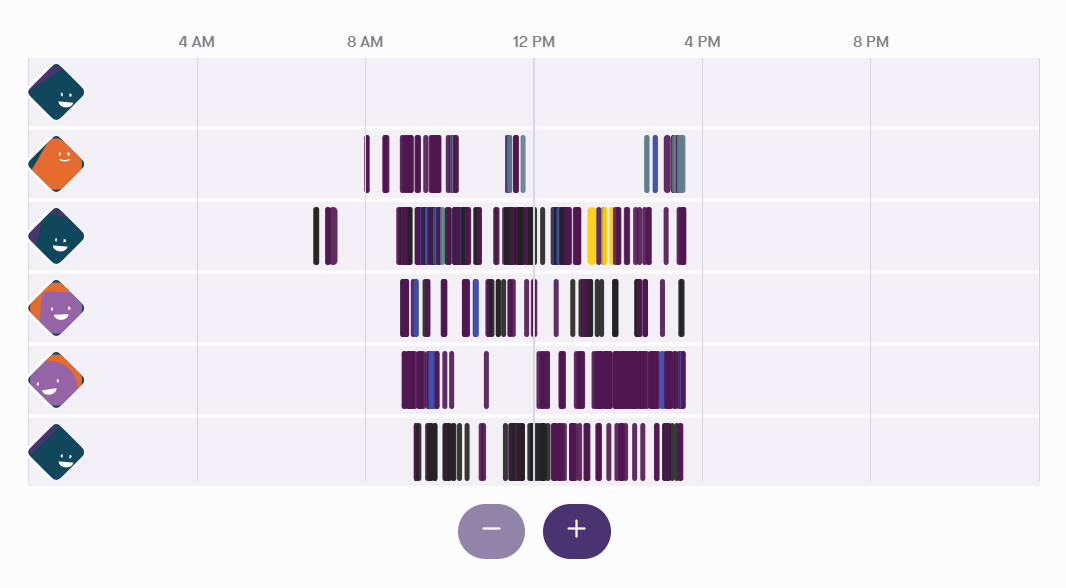
Redesigned timeline events and zoom in/out
Previously, we displayed each event in timelines as a bubble. We decided to use variable-width straight lines to help users better differentiate between events and also better reflect the timescale of the events.
Activities in the timeline view are now easier to differentiate from one another with the introduction of a zoomable and scrollable timeline.
Performance improvements
It now takes less time for your activity feeds and team metrics to be populated. We’ll continue to invest in UI performance improvements in successive releases.
Scalability improvements
The limit on the number of URL subscriptions a user can create has been increased. Previously, some users were blocked from creating additional subscriptions through the browser plugin or would stop receiving data entirely due to subscription quantity overwhelming caching in the extensions.
Improved account and user onboarding
The onboarding flow has been streamlined to get new accounts up and running quickly. We made changes for both the first user and subsequent invitees.
Set team role with invitations
Team owners can now set newly invited users to the desired team role when sending the invitation.
Browser extension design changes
Subscriptions now roll-up under apps. We also introduced a cleaner look and feel for the extension.
Subscription changes
Users now have the ability to choose what activity data they share with their Produce8 account on a per-app basis.
Notifications on account activity
An expanded array of actions that occur in the account (ex. inviting a user to a team, editing an app, etc.) will now be reported to relevant users through their notifications tray, personal activity feed, and emails.
Email preferences
We provide the option for users to opt in or out on particular email notification types.
Deprecated Feature - 'Activity this week' metric (temporary)
The graph that maps out each team members’ activity to the subscribed apps on a weekly basis is currently undergoing performance and design improvements.
Deprecated Feature - ConnectWise Manage integration (temporary)
Our beta integration with ConnectWise accounts is currently undergoing improvements.
Deprecated Feature - Microsoft Office 365 and Teams integrations (temporary)
Our beta integration with O365 is currently undergoing redesign.
Bug Fixes
Bug Fixes
Adjusting filters in quick succession sometimes causes the wrong activities to show up (PRO 1099)
An “apply this filter” button has been introduced when filtering on activities in the activity feeds. Now we do not update timelines and feeds in the UI until the filter is 'applied' or 'saved' by the user.
Activities aren't showing up in a logical location on the timeline (PRO 1058)
Activity placement in the timeline view is now more accurate.
Inaccurate activities with long durations are being generated
Long duration activities that would be generated due to automatic Chrome window refreshes will no longer occur.
Known Bugs
Known Issues
Chrome profile switches on windows generating inaccurate long duration events
Switching between Chrome profiles on Microsoft Windows is generating web app activities with inaccurate durations. We are artificially truncating these activities’ durations to a maximum of 30 minutes while we look at a better solution for this edge case. We believe this is a cause for some of the inaccurate long-duration events experienced by some beta users.
3 Major Feature Releases: Calendar Integration, Company-wide Metrics, and Sentiment
April 23, 2024
Introduction
How many hours do employees spend in meetings every week? Are they internal or external? How is that impacting their workdays? If you want to know the answer to all of these questions, the latest release should have you pretty darn intrigued because you can now actually measure all that in Produce8.
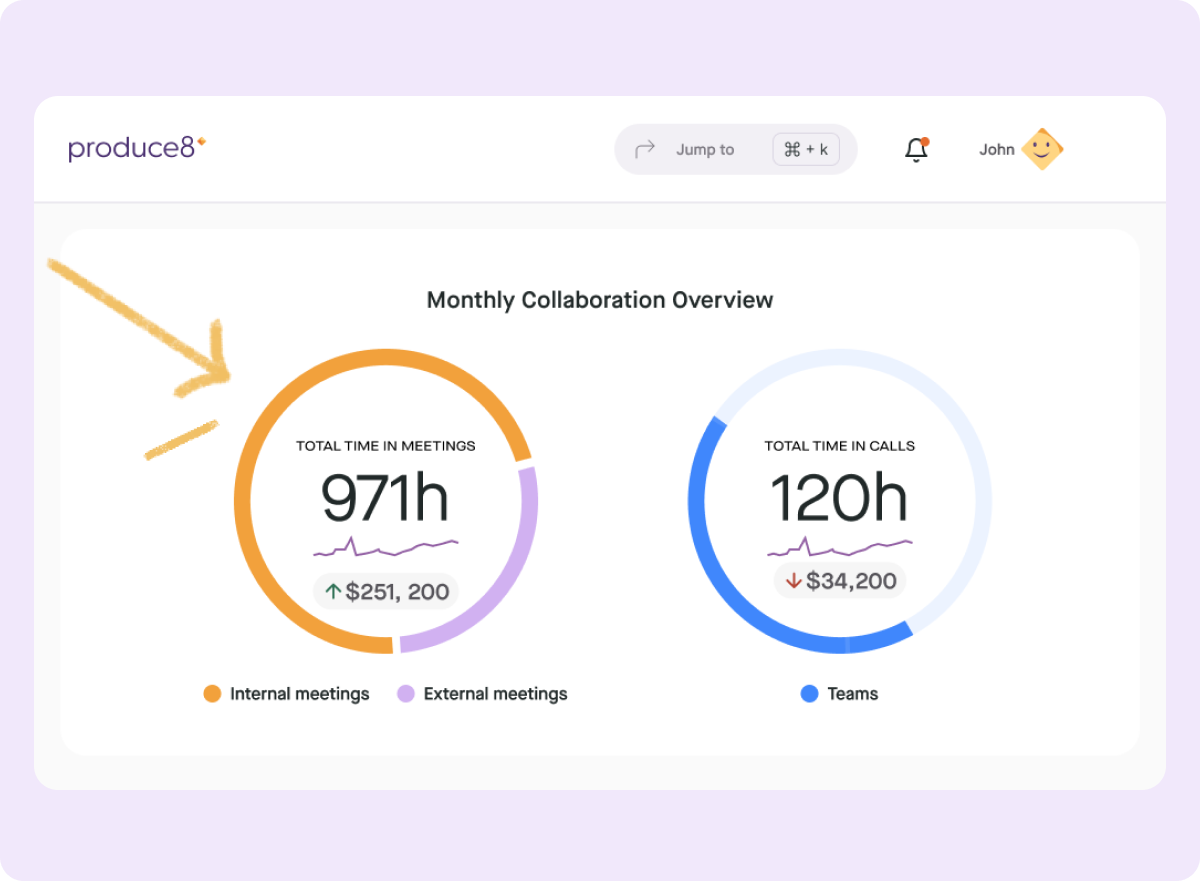
We are super excited to announce the release of our calendar integrations, meeting data types, and a host of features that surface organization-wide metrics. We are also rolling out a new employee sentiment feature that’ll help you keep a pulse of how all of your employees are feeling about their workdays (as a group) — all while protecting their individual privacy.
Sounds good? Well then read on…
- With ❤️ from the produce8 team!About This Release
These new features in Produce8 were built by: Jordi, Brandon, Anthony, David, Gavin, Sasha, Andrew, Jeff, Nicole, Wash, Christine, and Liam.
New Features
New Data Type: calendar integrations, meetings, and focus blocks
Produce8 now provides integrations with Google Calendar and Outlook to capture and report on calendar events. These are separated into internal and external meetings and focus time blocks. This calendar data is now used to show new meeting metrics features: a brand new layer of organization-wide reporting, personal user insights metrics, and goal-setting features.
How it works
Calendar events can now be added to personal and shared workspaces. As is standard throughout the app, workspace members opt into any data sharing. Users individually authorize Produce8 to link their accounts to calendar-based apps and to see their calendar data. Admin-level privileges in Microsoft and Google are not required for these integrations.
Calendar data is updated on a rolling basis once per hour so changes in your calendar may not be reflected immediately in Produce8. We do not update calendar data once the time of the events has passed, so if calendar items are after that, Produce8 will not reflect those changes.
As with all other data collected in Produce8, the user must opt-in to follow calendars to get data. They must connect their calendar identity with Produce8 to get data. We made that flow super simple for everyone.
With this release, individuals can now subscribe to their past and planned calendar entries and view them in a workplace timeline and their daily reports.
The addition of internal and external meetings and focused time blocks (tasks and calendar entries with no other attendees) brings non-digital work hours into the application (working offline). This also provides more color to your call data and captures meetings where call data is not available. Separating meetings into internal and external is also helpful for teams where meetings are a net positive (eg. sales calls), and where meetings are a potential hindrance to focused working time (eg. large internal meetings).
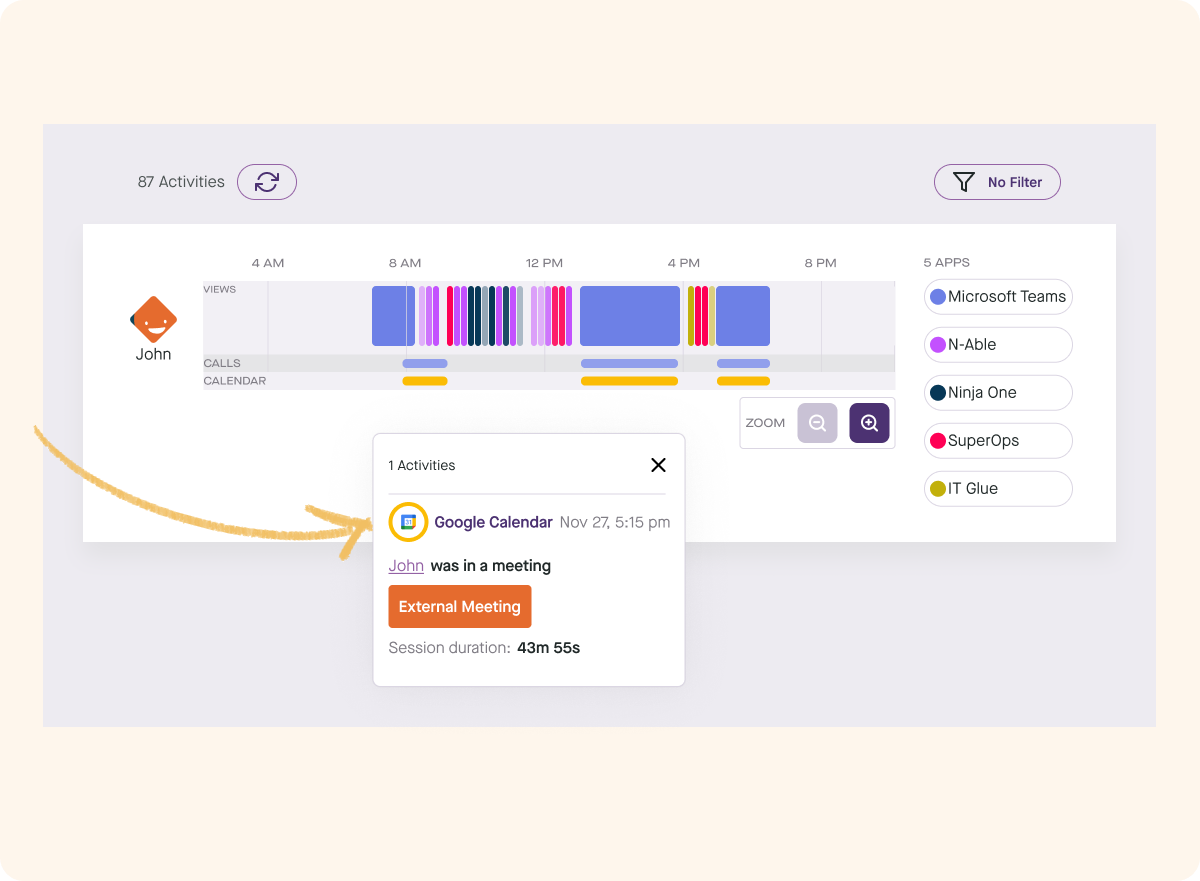
Calendar entries with no other people invited are considered focus sessions, which is the predominant use of calendars. We do not draw a distinction between a calendar entry for personal time such as lunch.
A calendar entry with more than one person associated is considered a meeting. Meetings with invitees on external email domains are considered “external”. Calendar entries that are ignored or discarded include all-day or multi-day events, out-of-office blocks, and unaccepted meeting invitations.
The daily timeline also offers an interesting comparison between the scheduled event and what happened in it. For example, examining a scheduled internal meeting on Zoom will show you if you are on the call for longer or shorter than expected.
By combining “view” data, you can also see how much time you were focused on the actual Zoom client. This work pattern bears more attention as you consider if the meetings you attended are aligned with what you want to focus on. You might consider either avoiding similar meetings in the future or helping improve to make it more engaging and relevant.
There is a new personal insights metric in your daily report that summarizes your time spent in internal and external meetings. Focused time blocks are excluded from this data.
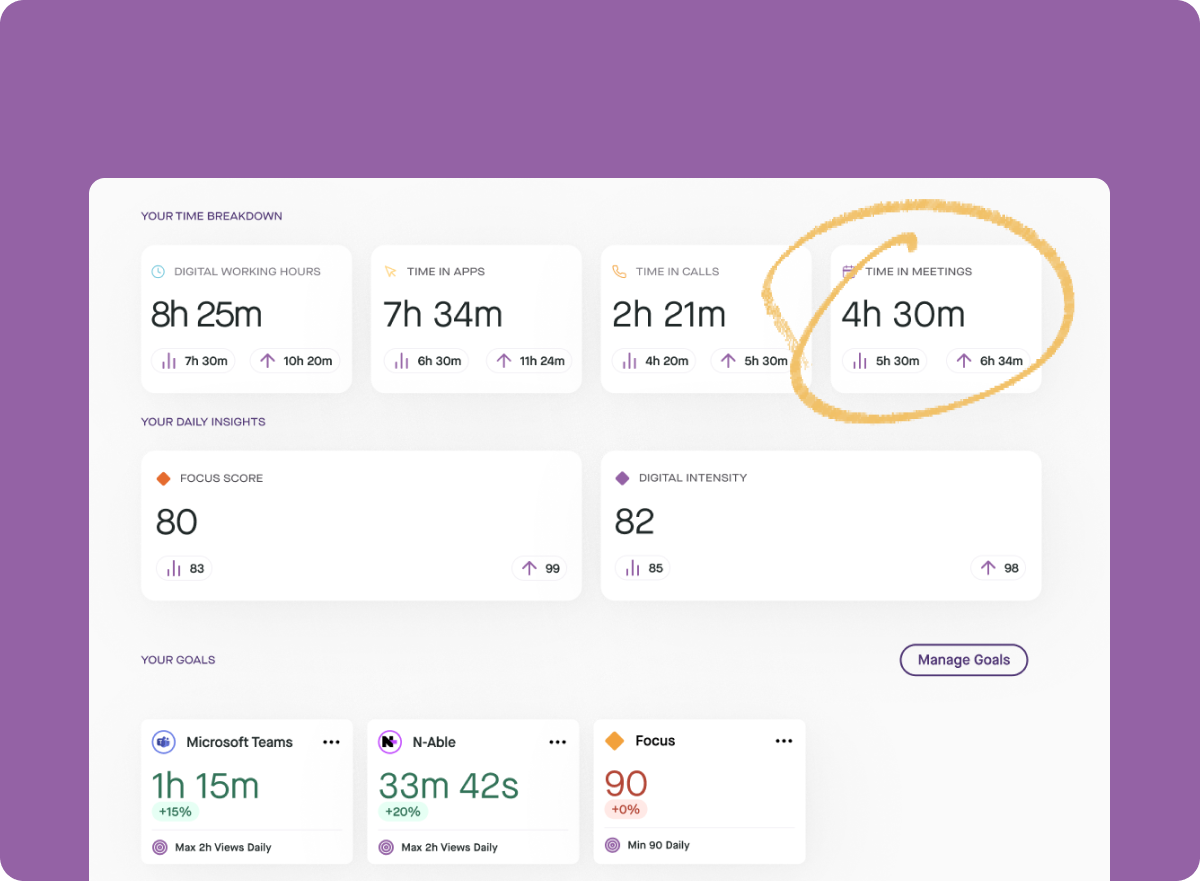
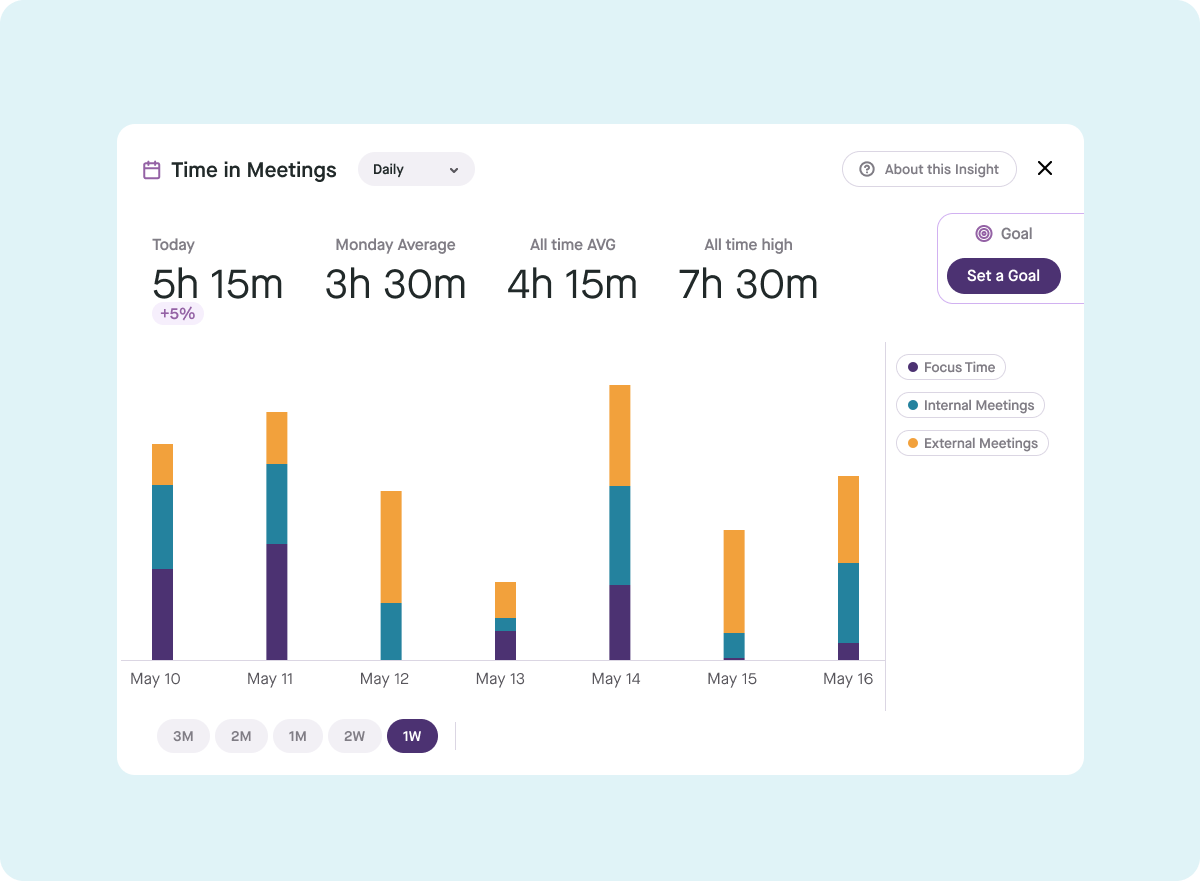
We also help you delve deeper into your time spent in meetings by providing access to time series data for that metric along with goal setting. If you are making progress, this is one place where it will show up.
New Dashboard: An organization metrics account dashboard!
With this release, Produce8 is now surfacing analytics that summarizes company-wide metrics. This data will be aggregated and anonymized, protecting individual privacy.
They are available to Account Owners, Account Admins, and the newly created Report Viewer role. They can be accessed in the user context menu, or by clicking on “Org Metrics” on the user home page and then clicking again on any element presented there
Understand the time spent in internal and external meetings across your business, including the nature of the meetings and their implied cost.
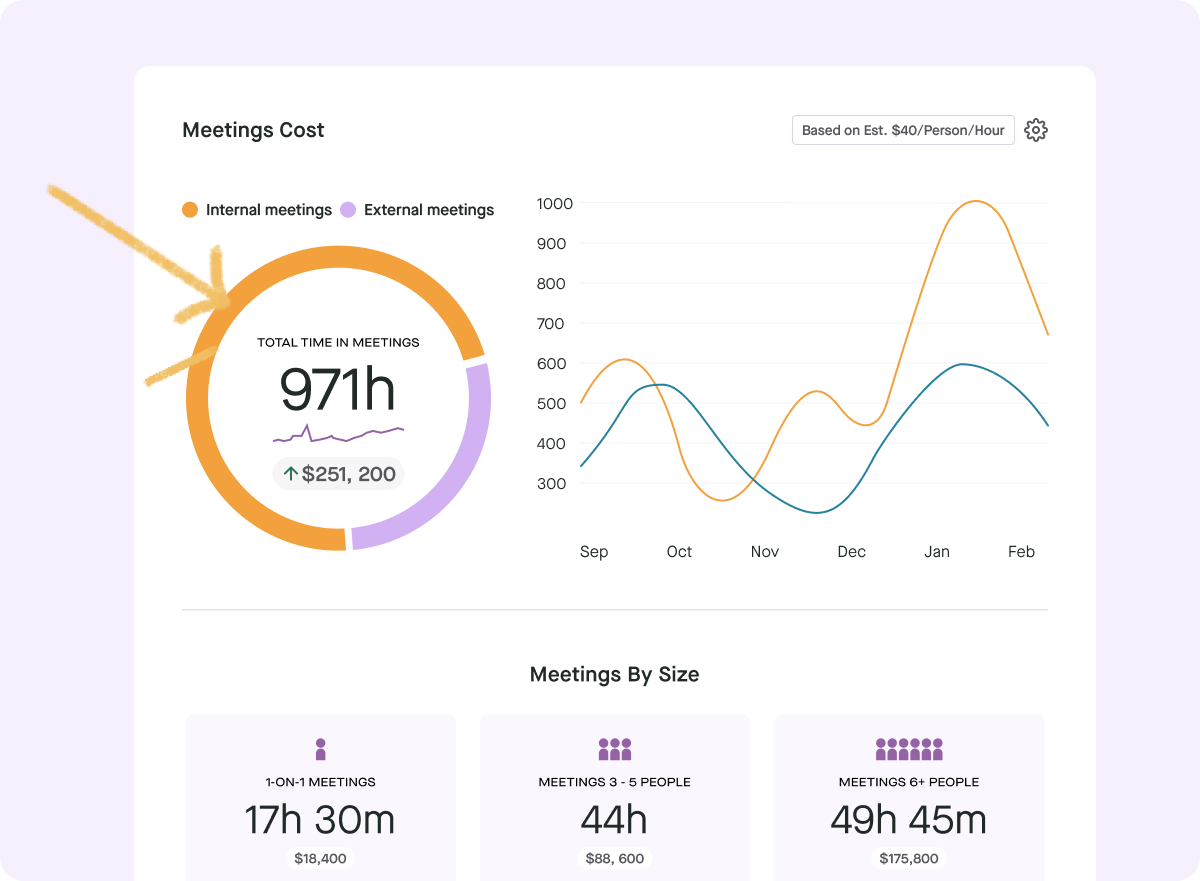
The meeting analytics tab can show you:
- Estimated meeting costs on a daily, weekly, and monthly basis and trends
- Breakdown of meetings held by size
- Meeting volumes in each of your teams’ shared workspaces
- Average calendar events spread across internal and external meetings and focused time blocks
- Average meetings per person over a time period.
Your company’s employees spend a lot of time in virtual meetings inside the business and with your customers and partners. Call analytics summarizes all that activity and its financial impact.
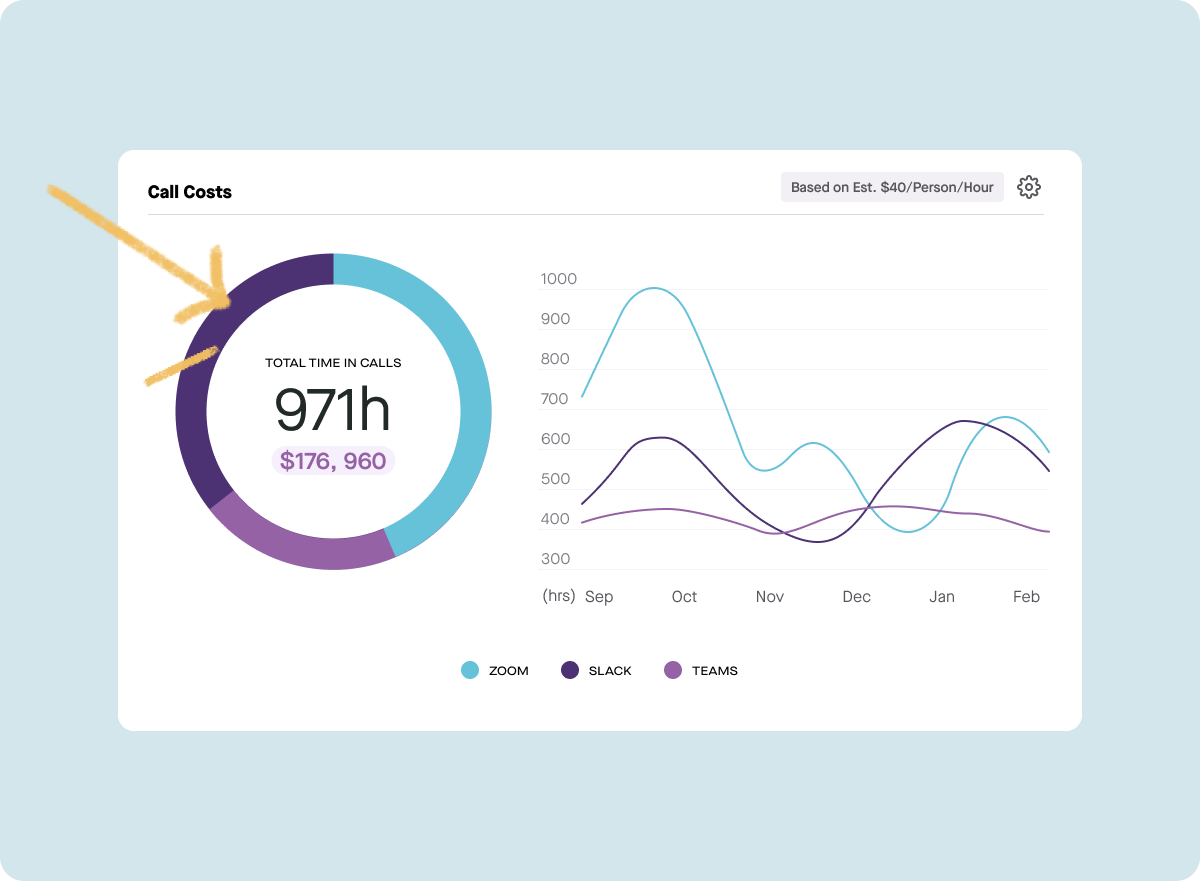
Calls visualizations include:
- The financial cost of virtual meetings
- Call data by team across your workspaces
- Calls data by each collaboration app you own
- Averaged calls per person per time period across the business
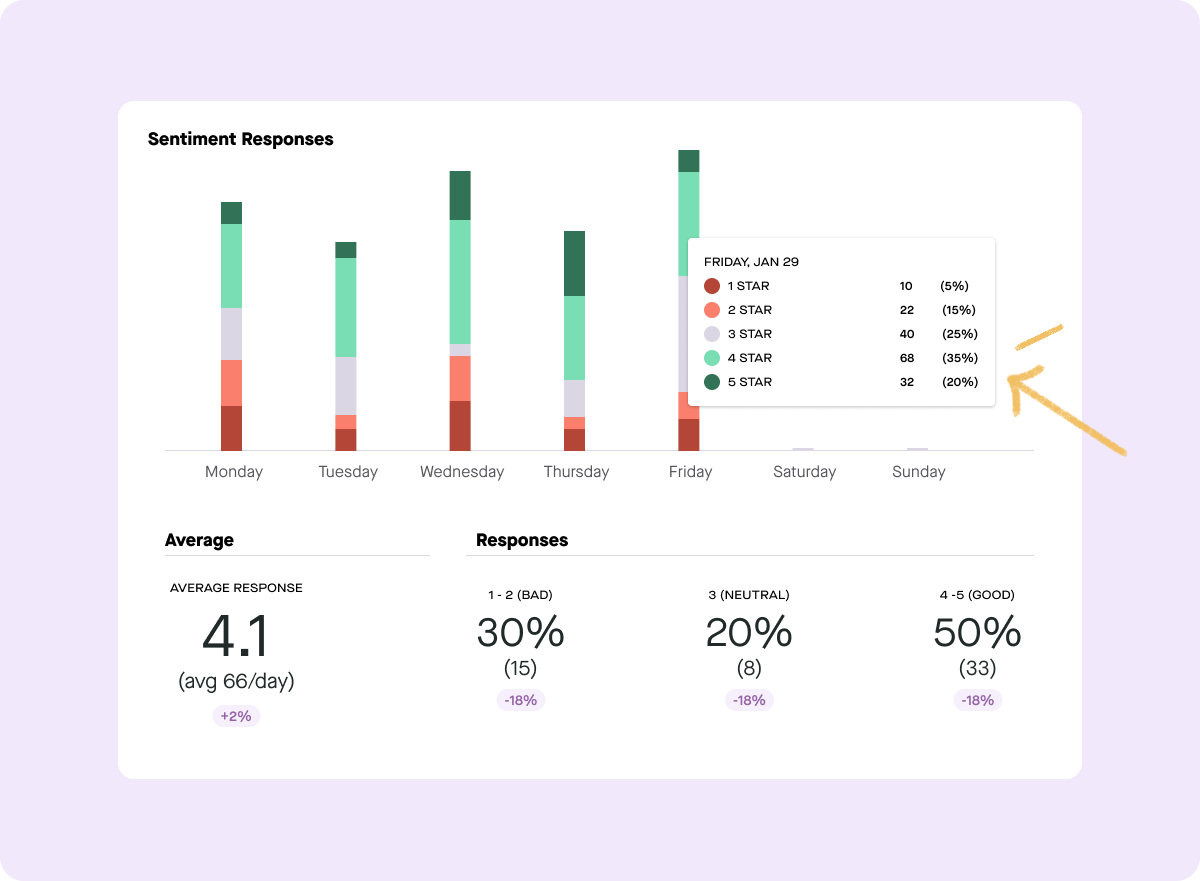
How is everyone in the business feeling about their workdays?
We built a new start-and-end-of-day check-in for every Produce8 user. While the specific replies of individuals are private to them, we summarize how the people in your business feel about their workdays by aggregating their end-of-day responses. This will give you a sense of things trending better as a result of the actions they — and your leaders — are taking to combat distraction, meeting overload, and all of the other factors that are stopping them from having better work days.
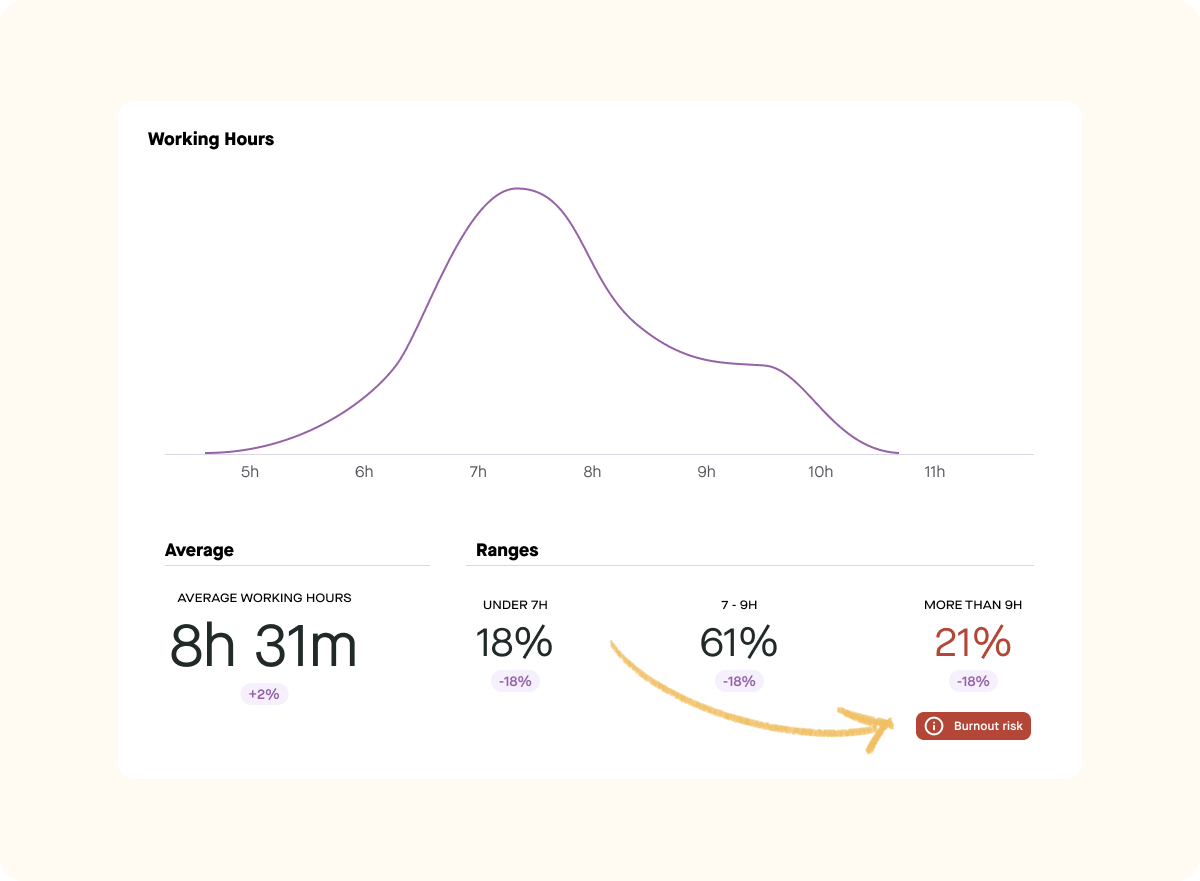
Produce8 already offers a personal insight metric to individuals on the length of their workdays as interpreted by the events we receive. With the inclusion of calendar and call data those numbers are now a more complete picture of the day and more useful to report on across the business.
We do not identify individuals, but working hours should give you a sense that employees are shifting to longer or more sustainable workdays. We included a Burnout Risk Calculator that is our first look at the potential impact of long working hours on the risk of employees experiencing negative wellness impacts.
The Burnout Risk Calculator should not be taken as an indicator of the percentage of your workforce that is overworked. That is a much more complex topic that includes many factors beyond simply their working hours.
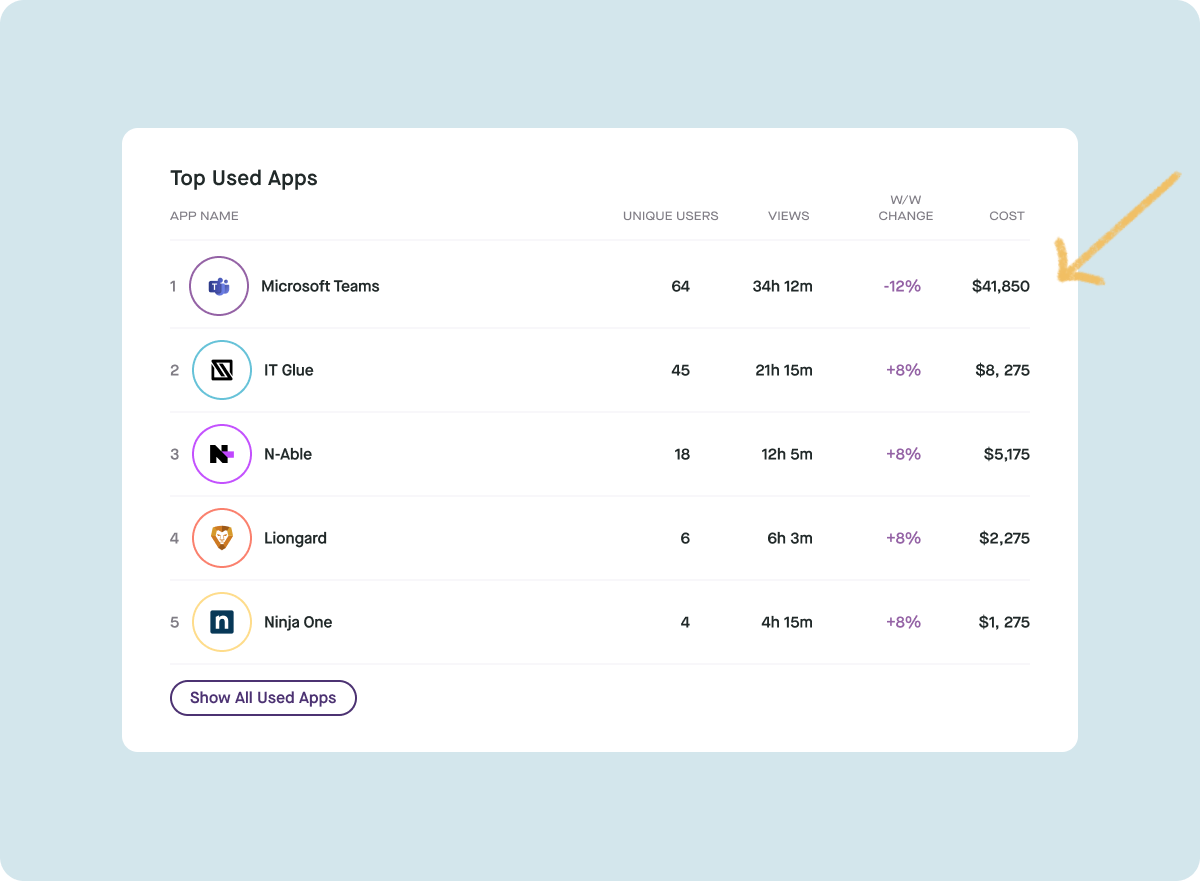
We already make this data available in personal and shared workspaces, but we have assembled this data company-wide. We report on time spent in your tools across the business in terms of time spent in each app every day. This will give you a sense of the usage of critical tools and also help you understand the potential financial investment that time represents.
To better support organization metrics visibility, we have introduced a new user role called “Report Viewer”. They have the same privileges as a regular account viewer with the additional ability to view the new organizational metrics dashboard for the whole account. In companies that want to extend complete transparency for all employees about organizational data, these roles can be granted across the entire business. There is no special user license required and the new role can be assigned in User Management under Account Settings.
For Report Viewers, Account Admin, and Account owner roles, there is also a new summary tab on the user homepage. You can flip back and forth between data about your day, and how the rest of the business is faring.

New feature: Employee sentiment in the daily plan
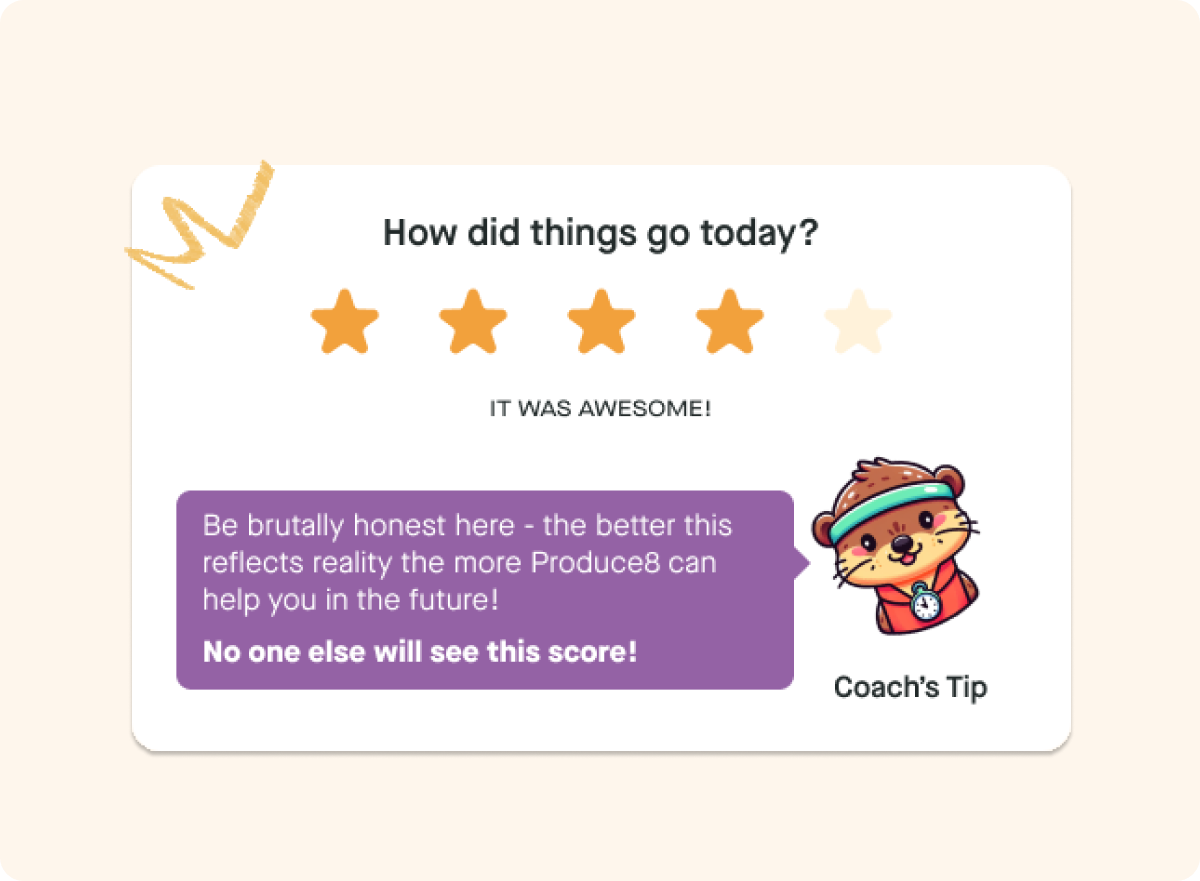
A big new feature to help anchor more intentionality into the workday is a start-and-end-of-day check-in on how you are feeling about your workday. The start-of-the-day check-in prepares individuals for the workday ahead. The end-of-day check-in is there to see how people felt the day went. There are text input fields available so you can provide some notes for yourself such as daily personal goals or more details on the score you gave the day.
The end-of-day check-in is anonymized and included in the organization metrics dashboard.
Any of Your Desktop Apps - Now Available to Study in Produce8
March 6, 2023
Introduction
Introducing the Produce8 Desktop Extension for Windows and MacOS.
- With ❤️ from the produce8 team!About This Release
A Desktop Extension for All of the Rest of Your Apps!
Boom! We have now launched a desktop extension for users that want to subscribe to their app ‘views’ on their local machines. We currently offer support for MacOS and Windows. The desktop extension is being released in ‘beta’ and we are looking forward to your feedback on design and usability.
Free Account Sign Up is Now Available!
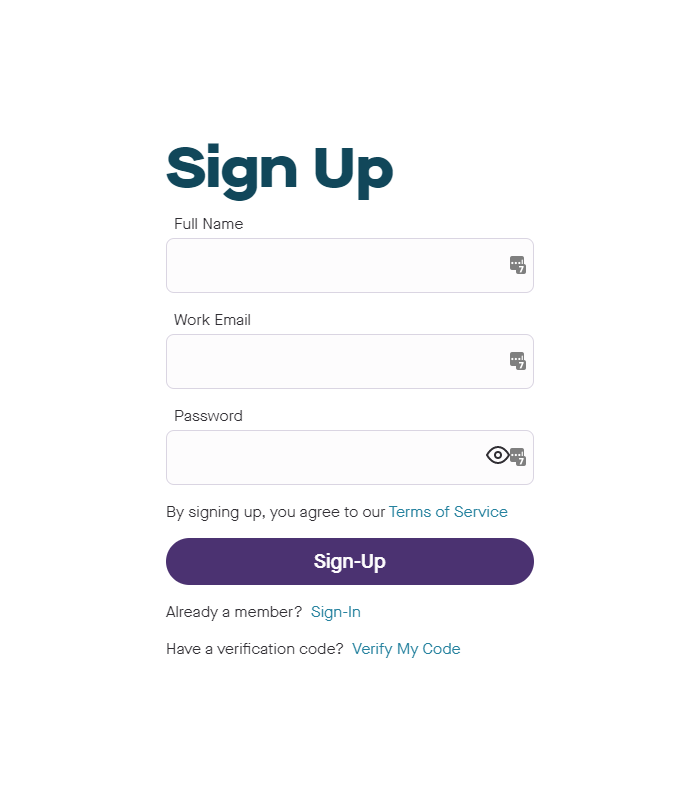
Big news! We have now launched the free version of Produce8. Please note, new features that have not received sufficient feedback from end-users, or where design is still being refined, may display a ‘beta’ tag.
Free Account License Limits
We have set the license limits for free accounts at five users, one shared (team) workspace, ten apps and up to three weeks of data history. We have also released the ConnectWise PSA integration in beta and it will be available to IT Service Providers for free as long as it is in beta. Please contact success to get the CW license added to your free account. Also reach out should you like to request more users or apps added to your account between now and the launch of our paid version.
Our Support Desk is Now Live!
We now offer both live and self-serve support. Submit a request via the Contact Support link in the app to log an issue, ask a question, request a feature, or deliver some feedback. We're typically online Monday-Friday between 8am-4pm Pacific time and aim to get back to you in less than 1 business day.
You can also access the self-serve knowledge base on our Help Center 24/7. We also have opened up a feature request form on the Produce8 website.
In addition, we welcome you to connect with us and other Produce8 customers on the Produce8 Customer Community on Slack. Request access by emailing us at support@produce8.com.
New Features
Desktop Extension for Windows and MacOS ‘Beta’!
We know that desktop-native apps represent 25-75% of our customers’ workloads, so as you add new desktop app subscriptions you can expect to see a pretty significant uptick in the data flowing into your team and private feeds.
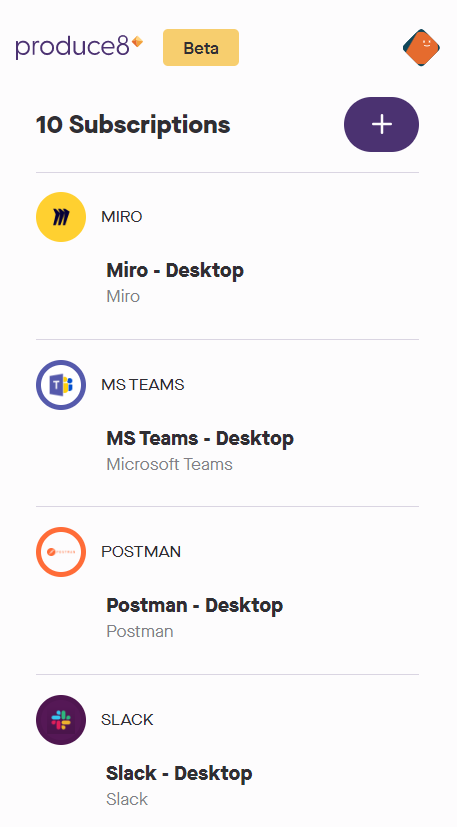
We will now display the new desktop app subscription ‘view’ type when users add, create and remove subscriptions from their workspaces. We will also combine desktop and browser based views into single metrics to help customers understand time spent in each app.
App creation is a little different than with browser based apps, as the service that users subscribe to will have a different name depending on OS release number and app vendor.
Over the Air Automatic Updates for the Desktop Extension
Updates to the desktop extensions will happen automatically ‘over the air’ so users should not have to maintain them. They will still be required to authenticate against them to build and maintain the connection between their desktop machines and their instance of Produce8.
Offline Data Synching
The desktop extension also offers offline logging, so if you are working away on your machine and lose connection to the Internet, or have unplugged intentionally, we can still synch your activity upon reconnection.
Desktop Extension App Catalog
As alluded to previously, creation, sharing and use of app subscriptions is a little different on the desktop. We have decided to offer an app catalog so that users don’t have to do the work of determining what the app service is called on their machine. We intend to add to and improve this feature over time and are certainly looking for user input.
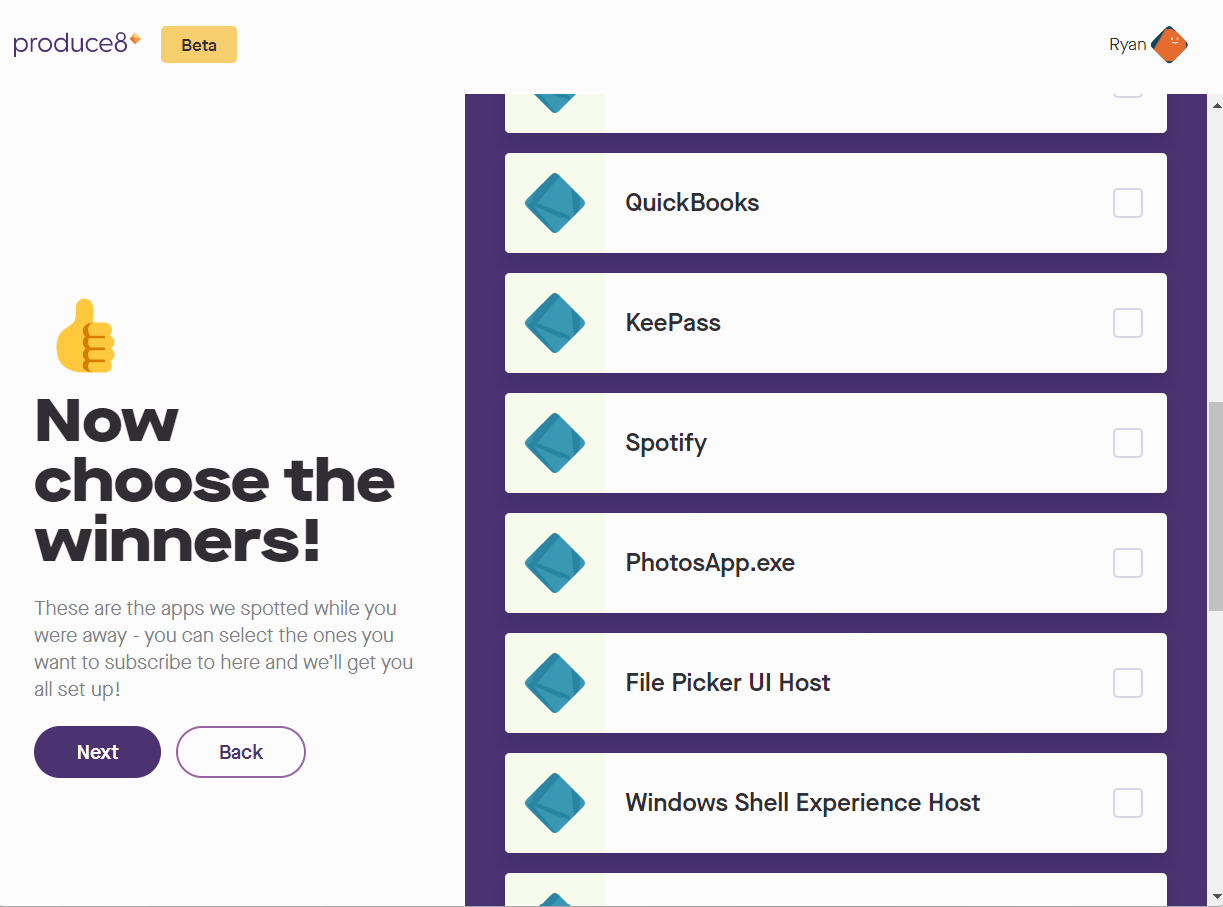
Desktop App Discovery
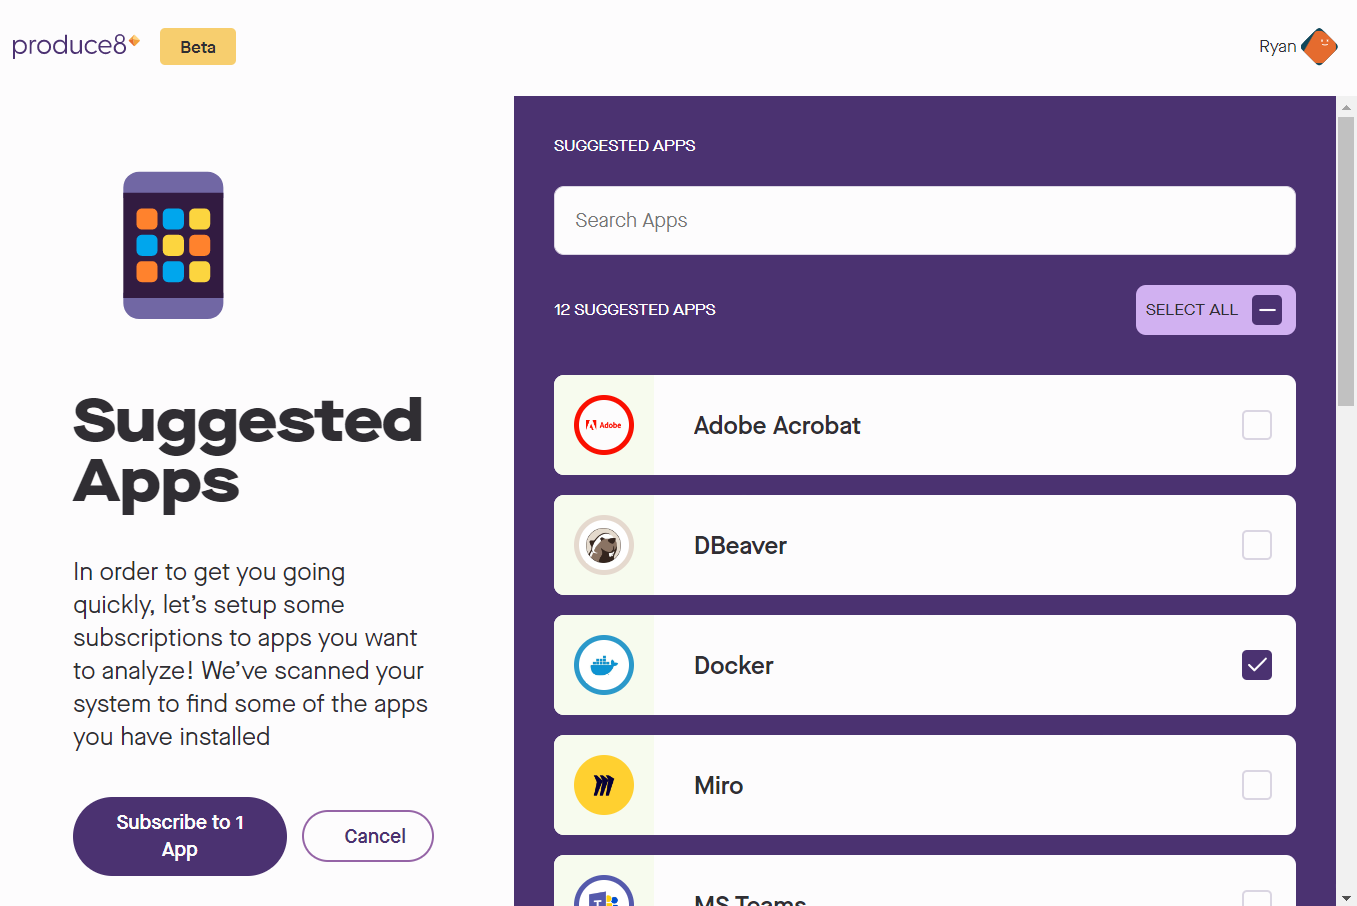
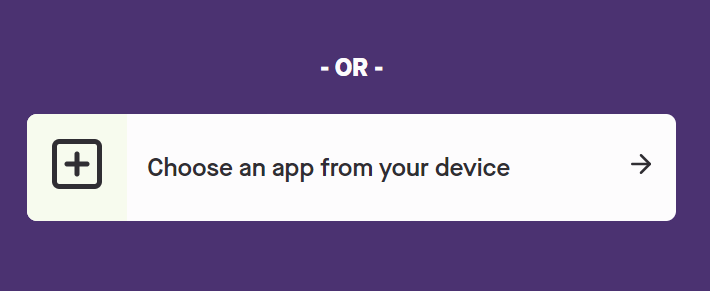
If you don’t see the desktop app subscription you want in our catalog, you can use our discovery feature to listen in and list the apps you have recently used. You can then select the ones you want to add to your account.
Produce8 Partner Center: Multi-Tenant Partner Portal
June 21, 2024
Introduction
Managed service providers (MSPs) are ideally positioned to help their customers understand and fix the impact of technology on knowledge worker productivity and wellbeing. We built a multi-tenant portal specifically for MSPs and Business Consultants to bring Produce8 to their customers, and to help them manage team engagement and success with the application over time.
Introducing Produce8’s Multi-Tenant Partner Portal
You can now create your customers’ Produce8 account in our in-app Partner Portal. With this new feature, you can manage the purchase and allocation of licenses across multiple customers and resolve account setup on their behalf.
The Partner Portal will list all your customer accounts and you can see their license usage and status. If given access by your customer, you can continue to manage the account for them by logging in to their accounts.
- With ❤️ from the produce8 team!About This Release
This new feature in Produce8 was built by: Andrew, Nicole, Sasha, Anthony, Jeff, Liam, and Christine
New Features
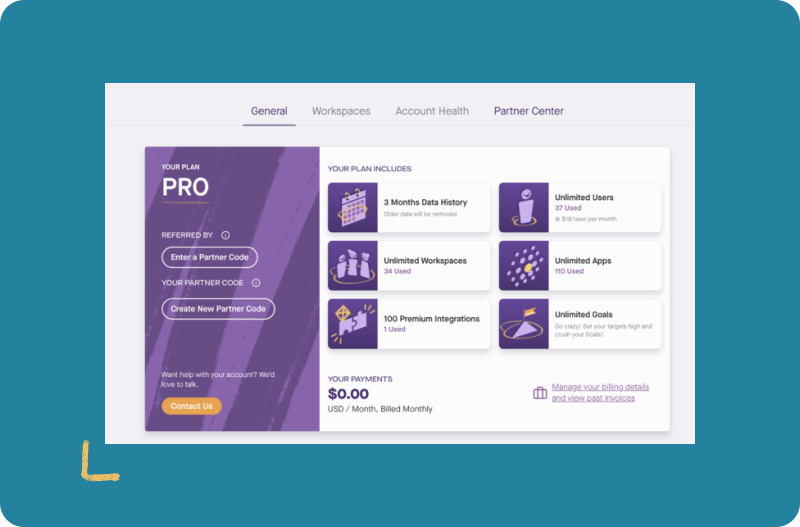
Accessing the Partner Portal from the Company Account Page
The new portal can be found by clicking on your company account page and selecting the partner center tab.
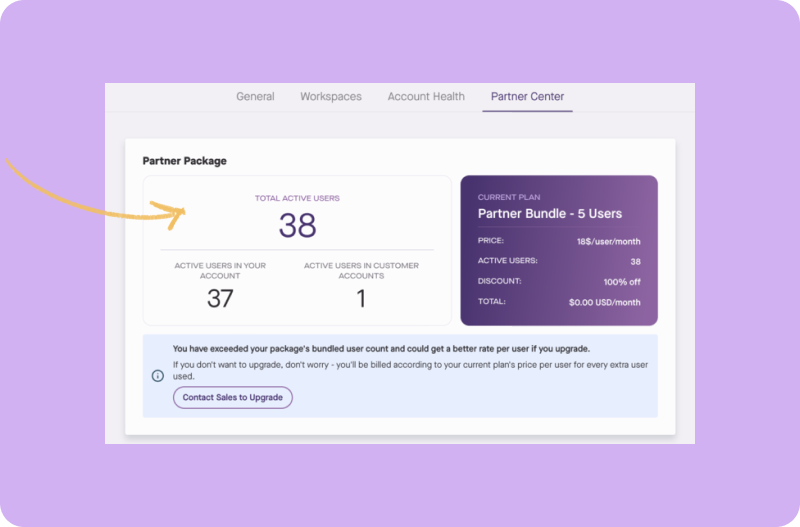
Partner Package Selection and Upgrades
You can manage your partner license count and view the current bundle and discount tier in the dashboard.
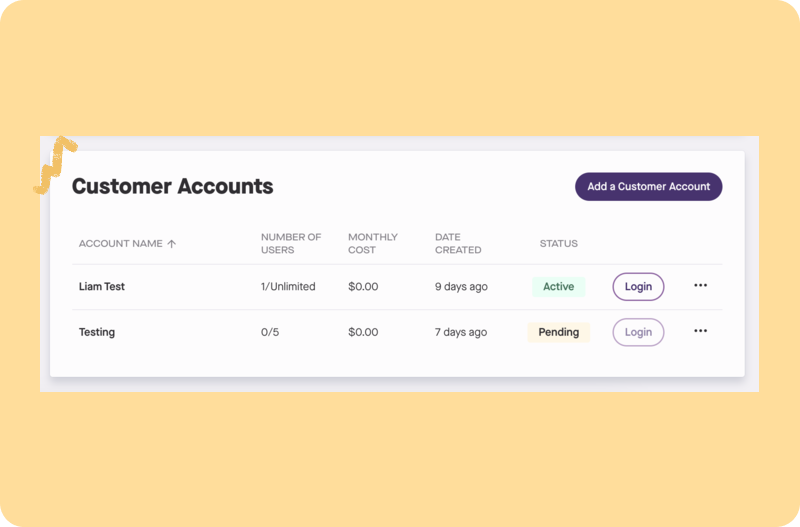
Customer Account Detail
You can create and manage customer accounts and view account status from the detail panel. If given access by your customer accounts, you can log in to their accounts to manage using the login button.
Create New Customer Accounts in Your Dashboard
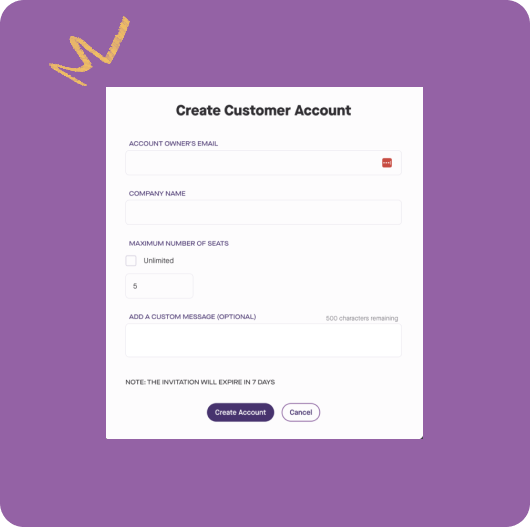
There is no need to wait for the customer to sign themselves up, you can create customer accounts right from your dashboard and then help them get set up. Enter the account owner (customer info) and allocate licenses from your pool to the account.
Major Feature Release: Goals
October 12, 2023
Introduction
Introducing Goal Setting in Produce8
- With ❤️ from the produce8 team!About This Release
You already know that Produce8 can help you understand how long and how often you engage with every app you use. But now we have taken it up a notch, and you can now set goals.
🏆 Set Your Sights on Success
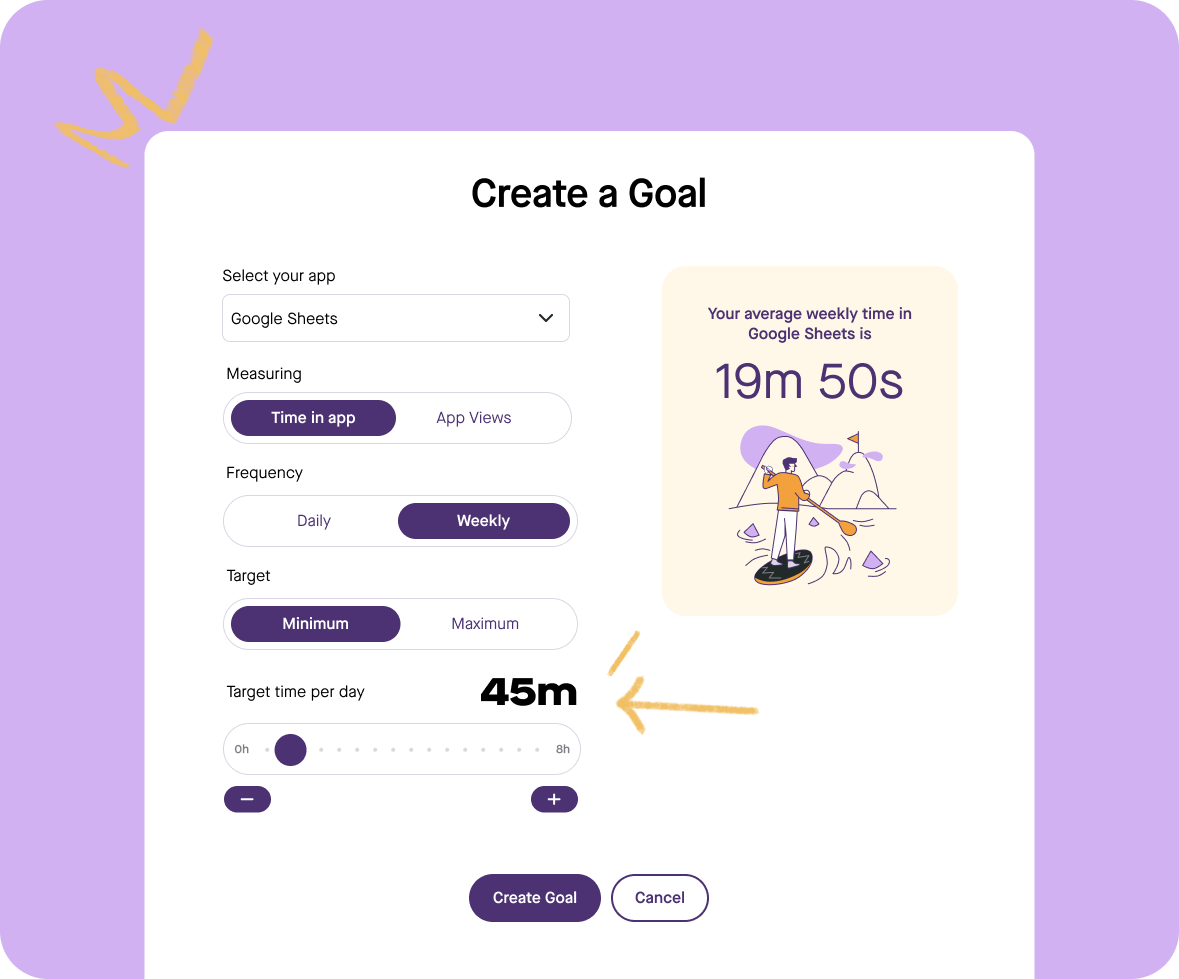
With Produce8 Goals, you can now set targets for your app usage and personal insight metrics. Whether it's 'screen time,' 'digital workday' length, or more, you're in control of your digital journey.
🔒 Goals for You, and Only You
Goals are a personal feature in Produce8. You can create, edit and remove them at any time and nobody else will know about your Goals or how you're progressing except you. So if you're hoping to spend more time in your CRM, less time in Slack, or capping those endless workdays, Produce8 Goals can help reinforce the changes you are trying to make.
⏱️ Available in Beta for All Accounts
Who can use Goals? For now, everyone can dive into the world of Goal setting. They will be permanently accessible to all PRO users and, for a limited time, to FREE accounts as a beta feature.
🎯 How Does Goal Setting Work?
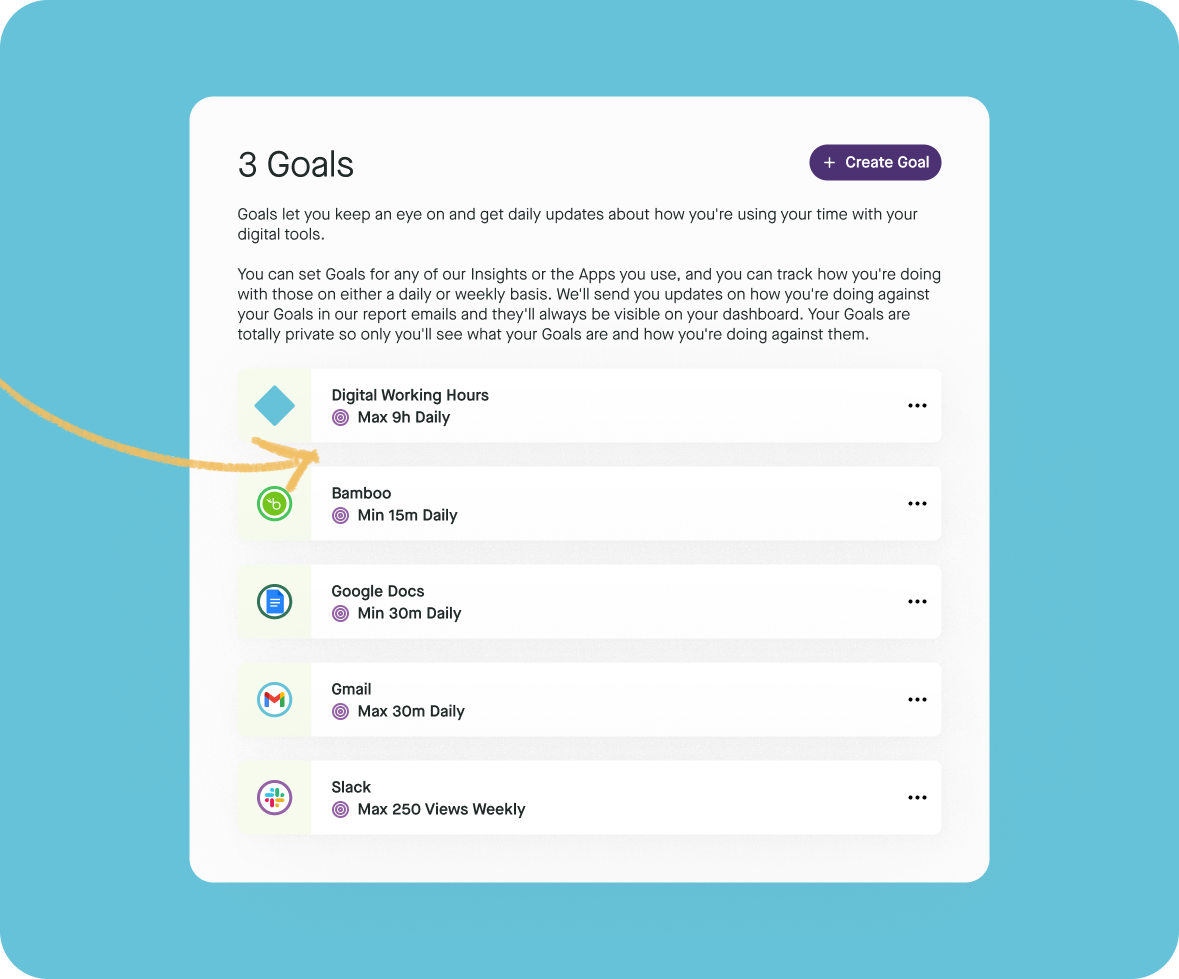
You can add a goal straight from your home page and you can edit them or remove them at any time.
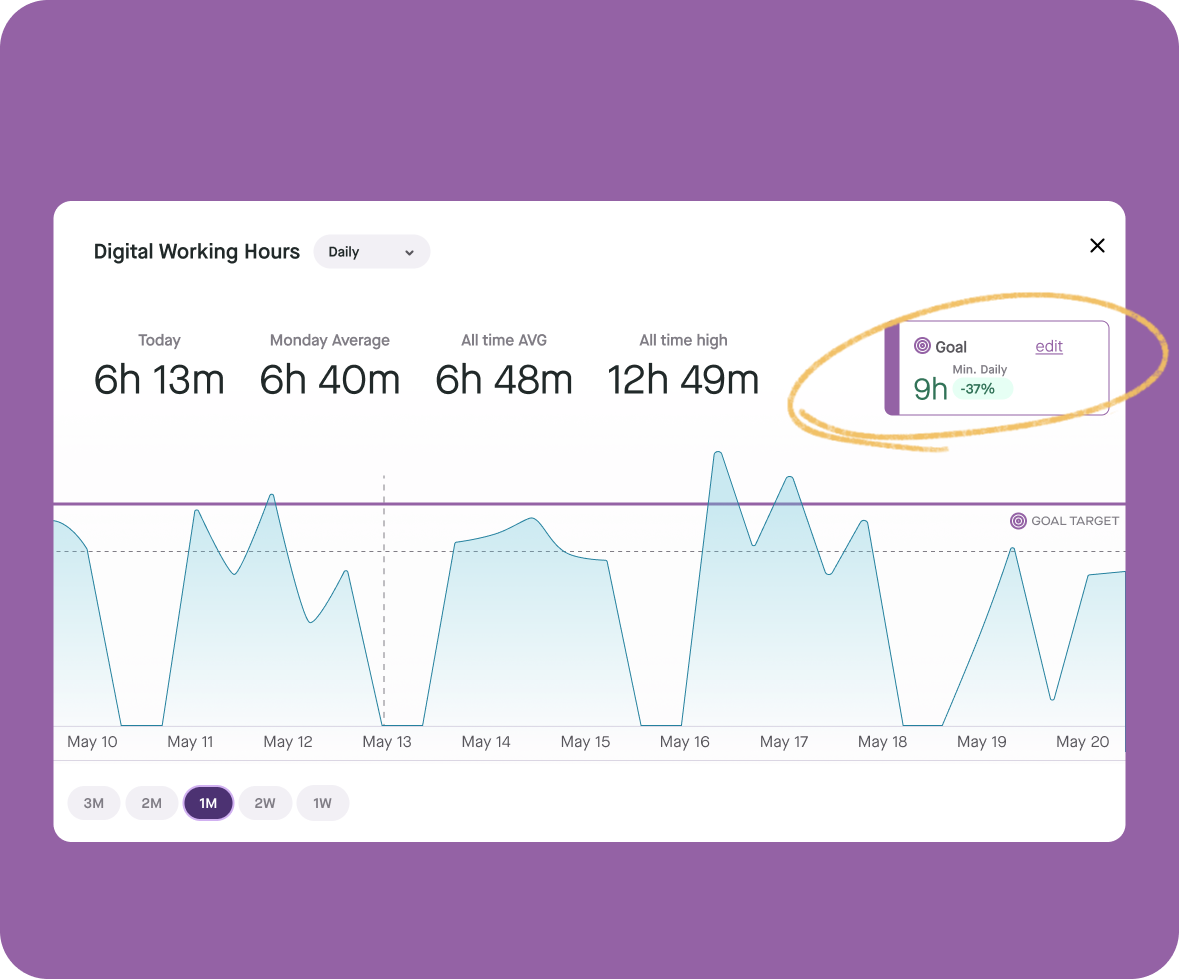
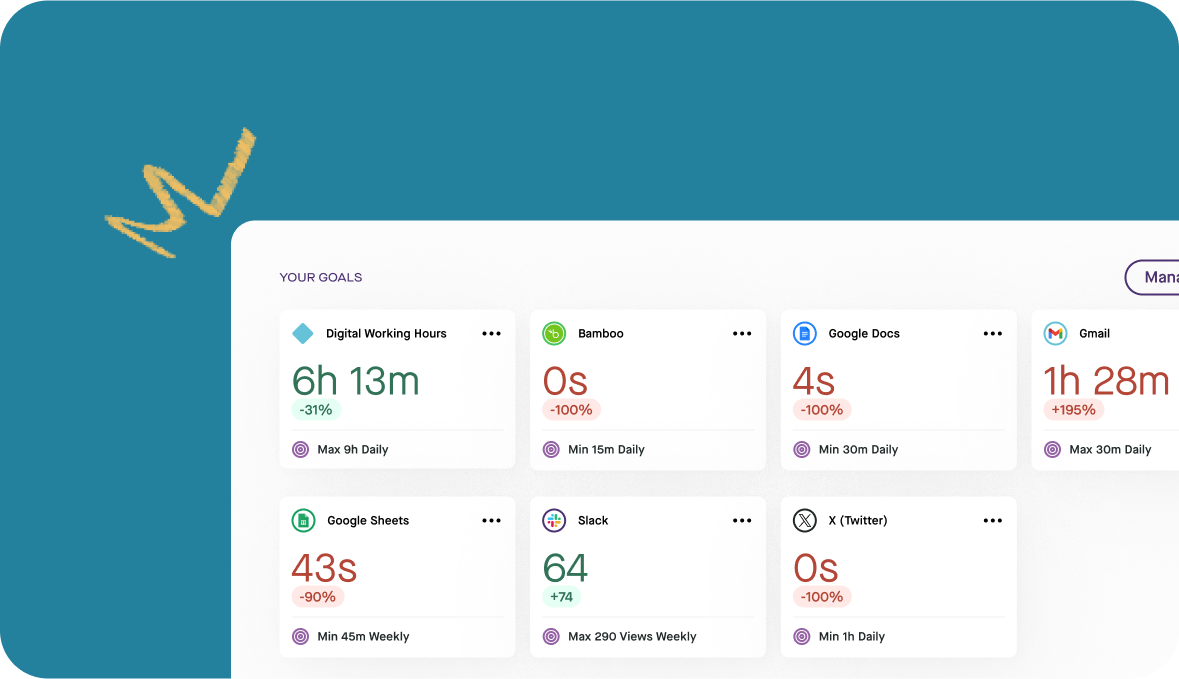
Clicking on a goal will show it to you in context of the scores or app metrics it is related to.
All of the goals and your progress against them will show up on your home page.
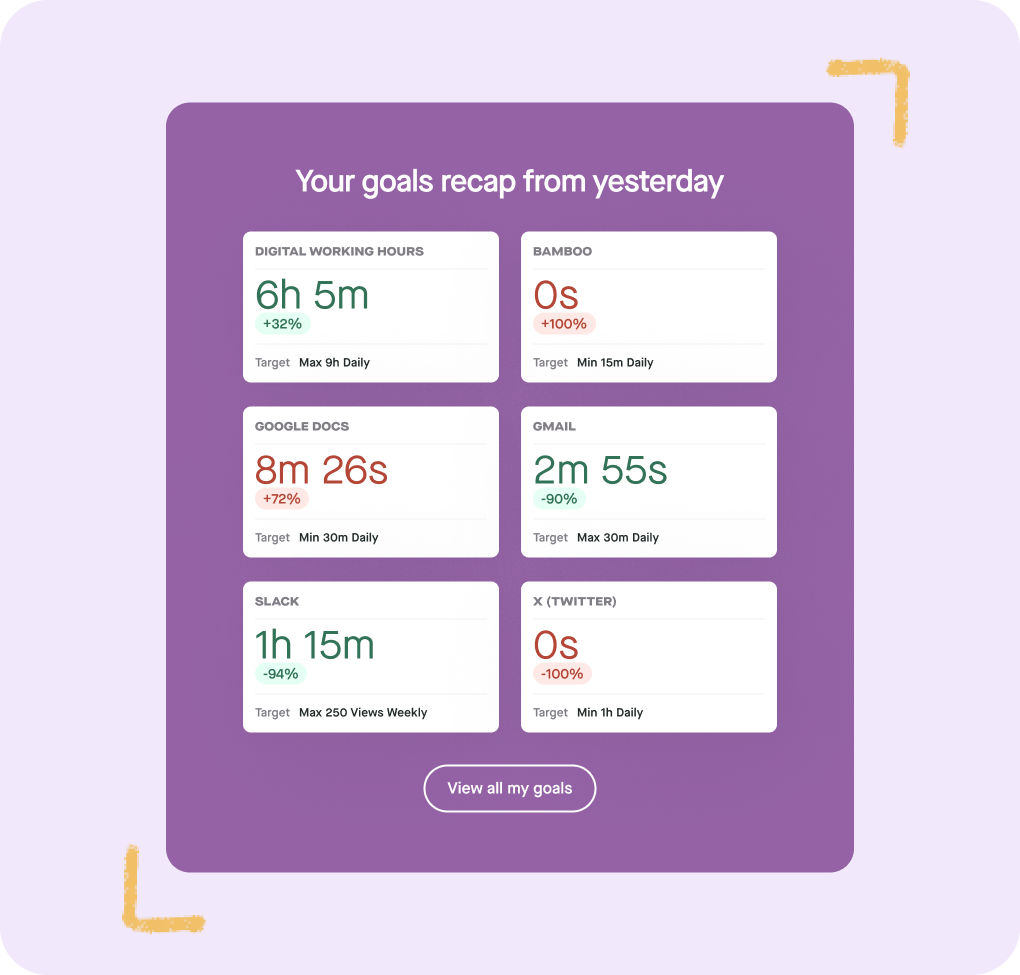
We are also sending you progress updates on your goals into your daily summary email.
🚀 Reimagine Your Workday with Produce8
Produce8 Goals is designed to help you craft a more intentional workday, your way. Set your Goals, break your limits, and achieve your aspirations! Don't wait – start your journey to success with Produce8 Goals today! 🌟🏆🎯
This new feature in Produce8 was built with love by: Andrew, Gavin, Michelle, Brandon and Jordi.
New Features
You can now:
👀 Establish minimum and maximum: time spent viewing apps, or on the number of interactions and average duration of your app views.
📈 Establish minimum and maximum daily and weekly targets for personal insights - screen time, digital intensity, focus and working hours.
Produce8 V1.4.0 (Alpha)
April 22, 2021
About This Release
The V1.40 release is a minor update with changes to ConnectWise events and KPIs, but we're still hiding the goods for the time being.
Watch this space!
- With ❤️ from the produce8 team!New Features
- The 'Activity Stream' for ConnectWise ticket events
- KPI for ConnctWise ticket close
- Minor UI updates
Bug Fixes
- Set maximum length of name
- Add loading animation on all transitions
- Invitation code can be verified from sign-up page
- Team editing menu closes when selecting an option
- Other minor fixes
Mobile App Updates and New Account Health Metrics
May 23, 2024
Introduction
The Produce8 mobile app updates for personal insights and sentiment are now live, and we have added some admin-level features to help you understand how adoption is going in your organization.
Introducing Account Health Metrics
We can now show all administrators of Produce8 how features are being adopted by their employees. This helps you understand if they have completed setup, downloaded extensions, added apps, and created workspaces.
Oh yeah, and the mobile app has been updated with some serious goodies!
- With ❤️ from the produce8 team!About This Release
This new feature in Produce8 was built by: Liam and Brandon
New Features
Account Health Metrics
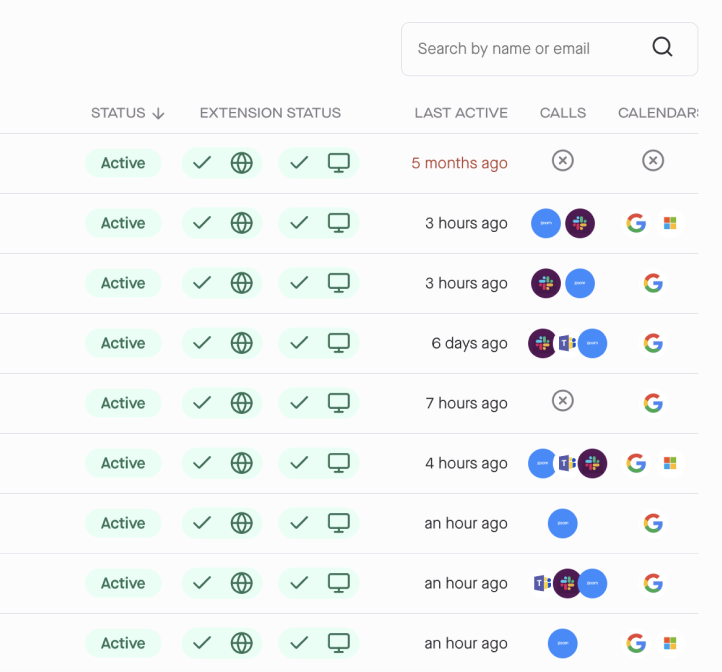
Access via the user context menu, Account Health Metrics helps you understand how the employees using Produce8 are progressing through adoption. We show you metrics on the number of people who have added each of the extensions and how many have authorized direct integrations.
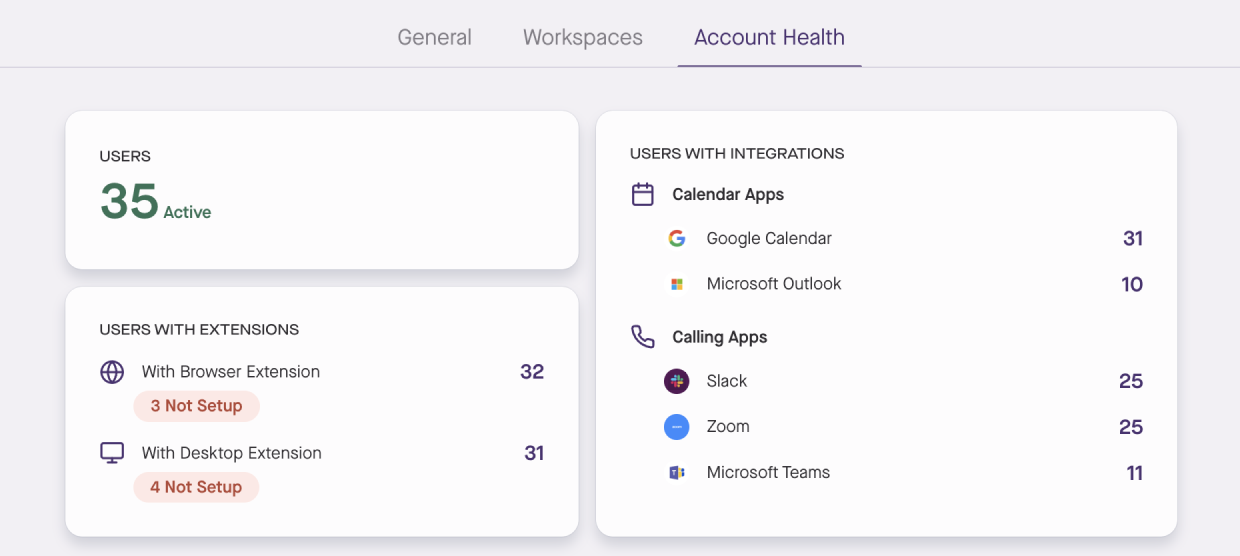
In your account, the status of each user can be viewed so you can see what integrations they have authorized and if they are using the extensions. As you are paying for them to use the app, if they are not getting value out of it or have not taken the time to get set up, you can nudge them to see if they need help.
Note: actual users are blocked out in the image below.
Mobile App Updates are Live for Apple and Android
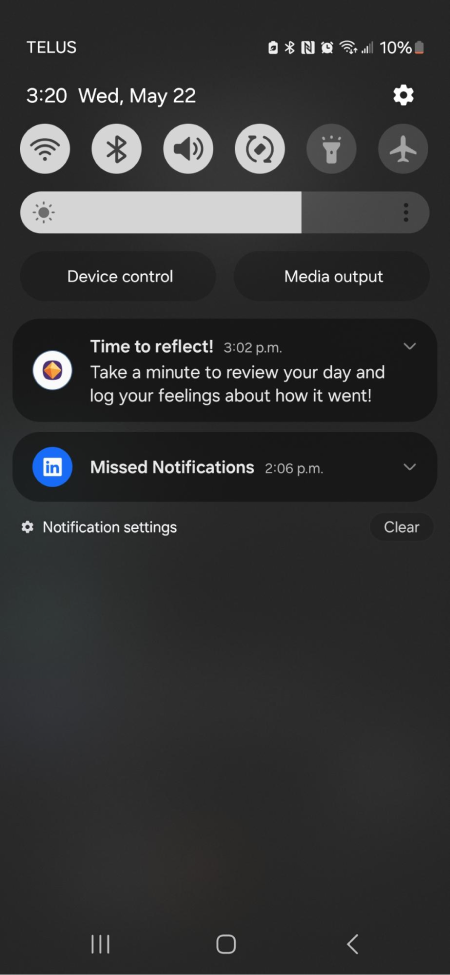
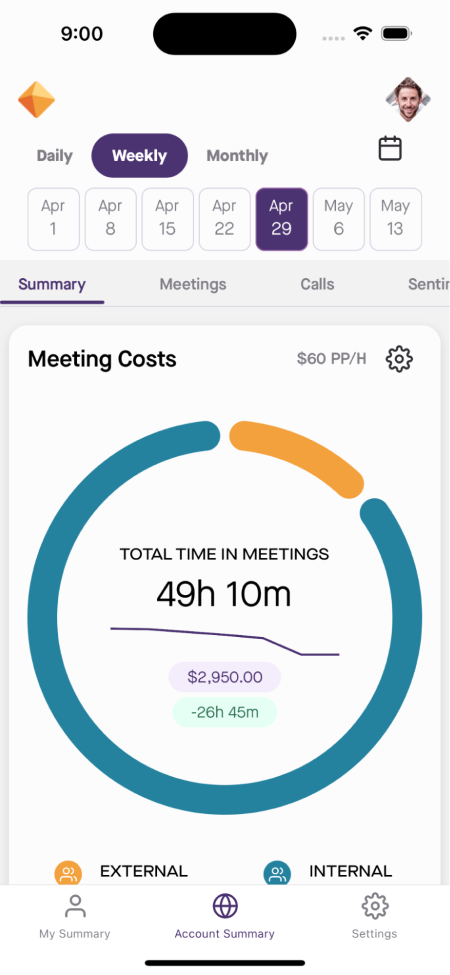
Most of the features introduced in April 2024 in the web application are now available on mobile.
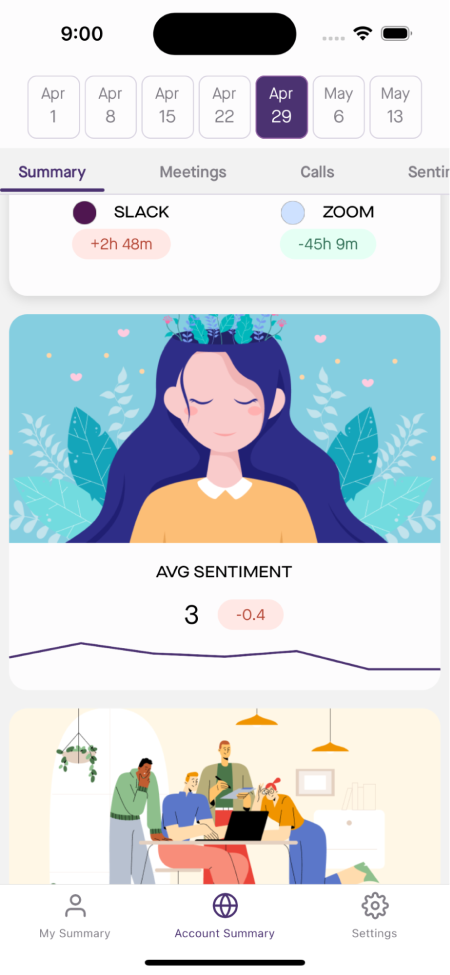
We now send push notifications to prompt users to enter how they felt about their workday, at the beginning and end of each day. It may be the only interaction your employees need from our app daily.
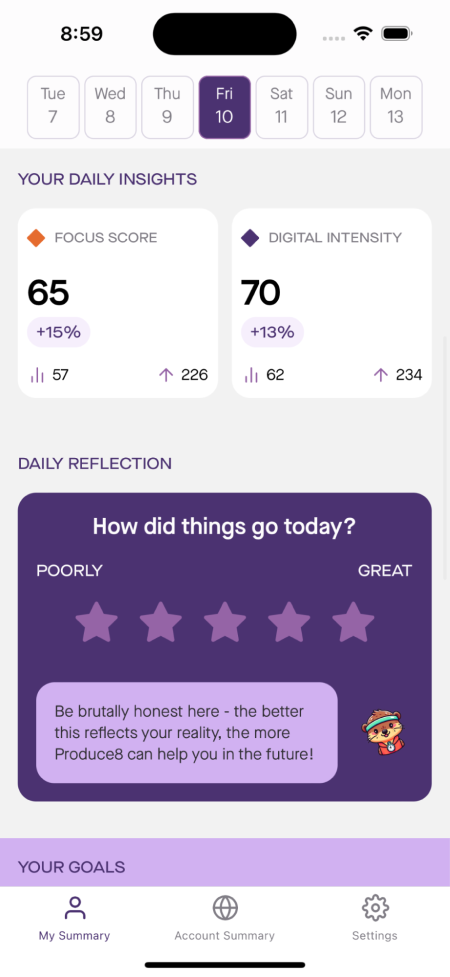
Your daily reflection is now included in the mobile app so your employees can do most of their engagement and reflection in a few seconds each day. This is a non-distracting way to update the app on your level of distraction!
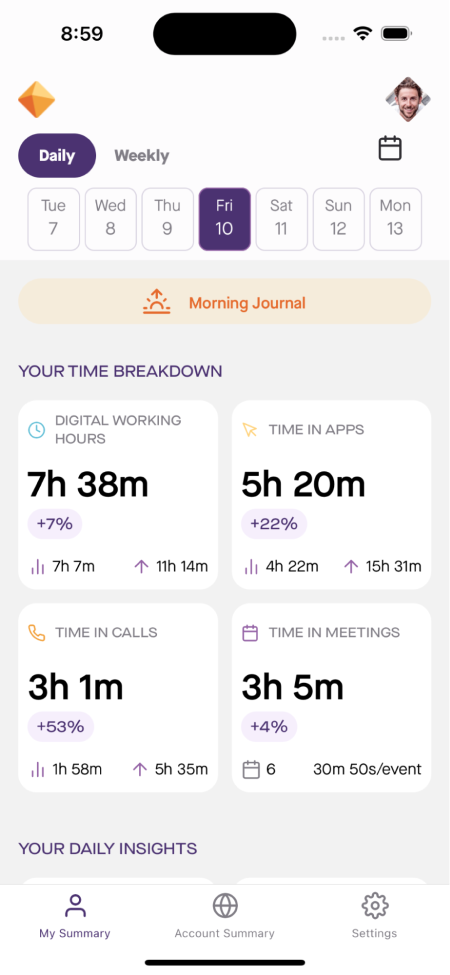
Added to the list of personal insights is the Time in Meetings metric. Are you wondering how much time you spent yesterday in online and offline, internal and external meetings? Well, now you know.
If you are an admin, an account owner, or have been granted the new report viewer privileges in Produce8 you can now view the account-level metrics from mobile. The summary dashboard is at your fingertips; you can keep tabs on company time spent in meetings, virtual calls, employee sentiment, and overworking risk.
Removed Features
It’s time to wave goodbye to the “Activity this Week” metric from the workspaces metrics tab. It’s been totally replaced by workspace metrics, organization metrics, and time series data for every app. Onwards and upwards!
Organization Challenges
September 4, 2024
Introduction
How do you drive change initiatives across your business that improve employee productivity and wellbeing? And maybe just as importantly, how do you know if they are working? How are your major digital transformation initiatives making their way down to reshape work habits and behaviours at the employee level?
We have introduced a game changing feature called ‘Challenges’ that will help your business make progressive changes to give your team time back in the day and measure their impact.
Introducing Produce8’s Organization Challenges
You can now create company-wide initiatives that anyone using the Produce8 app will be given visibility into. So if you are transforming meeting culture with new policies, tackling email overload with batch check-ins, or turning down the distracting nature of your messaging tools, Produce8 will engage the business and share the impact.
What impact? Well you will be able to view before and after anonymized and averaged per person changes to all metrics and insights collected in Produce8. It will also show you how the data has changed during and after your ‘Challenge’ in percentage terms compared to the prior time period.
No matter if you are leaning on an internal or external champion driving this change, Challenges will give them a tool to socialise the initiative, engage the business and report on progress.
- With ❤️ from the produce8 team!About This Release
This new feature in Produce8 was built by: Jordi, Andrew, Christine, Brandon, Anthony, Sasha and Jeff.
New Features
The Challenges Home Page
The Challenges homepage can be found by clicking on the user menu and selecting Challenges in the dropdown and displays all active and completed challenges.

Run New Curated or Custom Challenges
The Admin, Owner and Report Users roles in Produce8 can now create Organization Challenges by navigating to the User Menu and selecting Challenges or from the User Dashboard.

Customers can browse and make use of suggested challenges that Produce8 provides or create and manage their own custom challenges from scratch.
Challenge Insights
All users can see organization level challenges and view their progress. The details page summarizes changes to all insights since the challenge was started. You can select any metric tracked in Produce8 including taking deep dives into specific apps.

All of the challenge related metrics show before and after averages per person per workday and percentage change. The data is displayed in daily or weekly time periods.

If you are running a company-wide initiative to reduce meetings, time in meetings, time in calls and Zoom interactions are all at your fingertips. Importantly, sometimes there are unintended consequences of clamping down on one type of collaboration only to see another increase. So in this case you’ll want to understand how messaging and email tool usage changes over the course of a meetings related challenge.
Account Metrics
High level information about Challenges is also available on the Account Metrics page.

User Homepage Updated to Include Active Challenges
We bring the challenges right to your homepage so you can stay on top of the initiatives that are running across your business.

Check out our New Challenges Resource Center on our Website
Produce8 ‘Challenges’ don’t just exist in the app, we have also built a full resource center that can help you understand how to relate organization, team and individual productivity and wellness initiatives to results in Produce8.

Check it out at https://www.produce8.com/challenges
Produce8 V1.5.8 (Beta)
January 6, 2022
About This Release
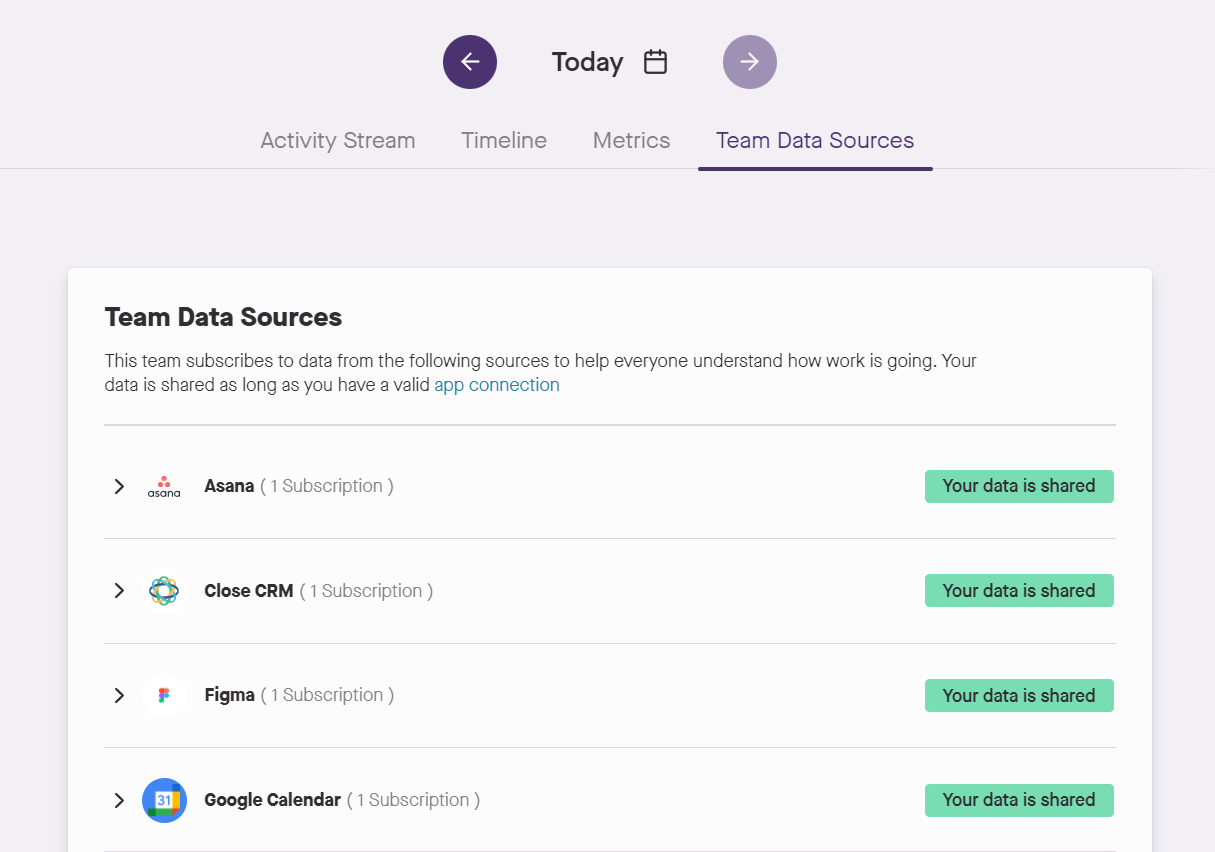
This minor release introduces a tab to help all users see which data sources each team subscribes to.
- With ❤️ from the produce8 team!New Features
Allow all team users to see which data sources the team is subscribed to
Prior to this release, you needed access to the team settings page to view the team's subscriptions. This access requires team owner permission.
We now show all members of the team a list of the team's subscriptions. For each team member, we also identify whether or not they are connected to those.
A "Team Data Sources" tab has been added to the team page, next to the metrics tab.
Produce8 V1.4.3 (Alpha)
May 13, 2021
About This Release
This was a major release addressing some new features, bug fixes and improved integration health for ConnectWise Manage.
- With ❤️ from the produce8 team!New Features
ConnectWise integration
Validate company ID, public and private keys for ConnectWise Manage integration and subscribe to events.
O365 integration
Users can connect to O365 to enable subscriptions. Subscriptions haven't yet been released, so there's currently no data displayed in the activity stream or timeline.
IT Glue integration
The initial integration to IT Glue was enabled to allow users to display daily user-activity metrics in Produce8.
Activity stream
The activity stream is the feed of user activity from applications in a chronological display. User actions, such as creates, updates and deletes are displayed.
Metrics
Simple tabular metrics are displayed in the user and team metrics tab.
Team role management
The ability for team owners to be able to assign roles to users, edit those roles and see those changes take effect.
Integration user mapping
Bug Fixes
User login error
Some users were experiencing login issues after account creation.